
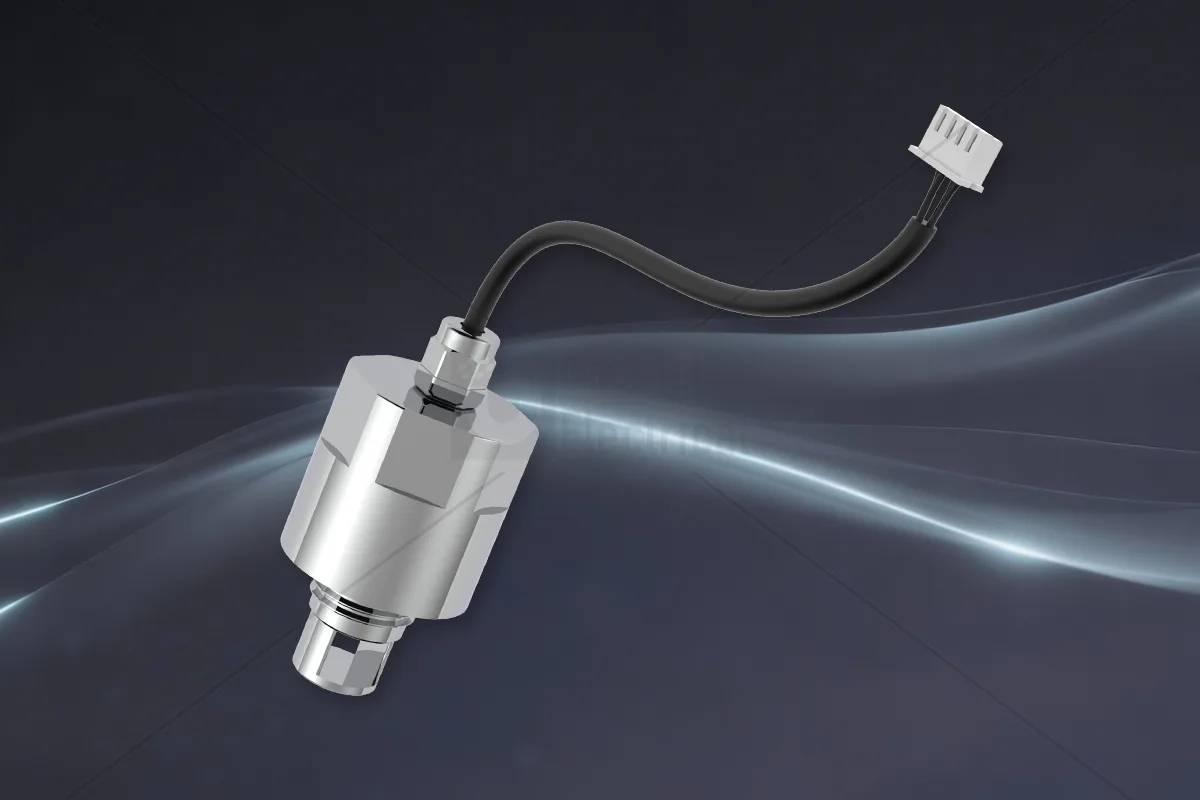
The NSDD-Lite3 is a compact multispectral water quality sensor that simultaneously measures TOC, COD, UV254, and temperature online. It features a non-contact optical design, requires no chemical reagents, and supports UART or RS485 isolated digital communication. For equipment manufacturers and system integrators, integrating the NSDD-Lite3 into an equipment display or user interface is not just about printing serial data—it is about converting raw measurements into information that operators can correctly understand, trust, and act upon. This article focuses on a core engineering problem: how to present trends, units, temperature context, maintenance status, and data staleness prompts to avoid misleading users into interpreting a single reading as a complete water quality conclusion.
Engineering Problem: From 'Reading Values' to 'Making Decisions'
Many equipment displays show only a single current value, such as an instantaneous TOC or COD reading. This presentation implies two incorrect assumptions: one, that the current value represents a stable state, and two, that the user knows the context and boundaries of this value. In reality, water quality parameters fluctuate with flow, temperature, water usage patterns, and pretreatment status; the sensor itself may also be affected by optical window fouling, bubbles, or communication delays. Therefore, the interface design must allow users to see trends over time rather than being constrained by isolated numbers.
Trends answer the question 'is the system getting better or worse,' units answer 'how large is this value,' temperature context answers 'why is this value changing,' maintenance status answers 'is this sensor still reliable,' and data staleness prompts answer 'is this number still fresh.' None of these five dimensions can be omitted.
A typical misreading case: a water treatment equipment only displays the current TOC value of 2.1 mg/L on the panel. Users see fluctuations and assume water quality is abnormal. In reality, this fluctuation may simply be due to water temperature dropping from 20°C to 5°C or air bubbles entering the sampling line. Without trends and temperature context, operators will make wrong judgments—either ignoring real contamination or triggering unnecessary maintenance work orders.
Decision Methodology: Define the 'Role' of Each Displayed Parameter
Before integration, the engineering team should clarify the role of each parameter in the UI. The table below provides recommended practices:
| Parameter | Display Purpose | Recommended UI Form | Considerations |
|---|---|---|---|
| TOC | Total organic carbon trend | Trend curve + current value | Specify units and temperature compensation |
| COD | Chemical oxygen demand surrogate screening | Trend + threshold alarm | Cannot replace laboratory COD analysis |
| UV254 | Organic matter absorption characteristic | Trend or auxiliary indicator | Note interference from turbidity |
| Temperature | Background and compensation reference | Value + background color | Used to explain short-term fluctuations in other parameters |
| Maintenance status | Sensor health | Icon/text | Distinguish fouling, communication anomalies, needs inspection |
| Data freshness | Time of last valid data | Timestamp + staleness prompt | Gray out or blink when exceeding threshold |
This decision table not only helps UI designers but also helps system integrators align with customer expectations during bidding or solution phases. When selecting display parameters, follow the principle 'essential > useful > optional.' For devices aimed at non-expert users, do not display all parameters simultaneously; instead, highlight one primary parameter (e.g., TOC) and temperature, and collapse other parameters into an advanced menu.
Implementation Steps: From Serial Data to UI Components
1. Communication and Data Parsing
The NSDD-Lite3 offers UART or RS485 communication options, and using isolated digital communication improves interference immunity. During integration, first configure baud rate, data bits, stop bits, and parity according to the selected interface, then parse the data frames per the product communication protocol. Focus on extracting TOC, COD, UV254, temperature, and device status fields. It is recommended to implement frame checksum and timeout retry mechanisms in the parsing layer to ensure the UI is always based on complete, fresh data.
2. Data Preprocessing and Unit Conversion
Map raw register values to engineering units. TOC and COD are typically displayed as concentration units, while UV254 is displayed as an absorption coefficient. The exact units must align with the NSDD-Lite3 factory data sheet and be clearly labeled on the UI. The NSDD-Lite3 performs temperature correction internally, but the UI should still display the temperature value because operators need to know the temperature context under which the measurement was made. For example, sudden cold water entering the piping can cause apparent changes in organic concentration; displaying temperature helps avoid misinterpreting this as a contamination event. It is recommended to apply first-order low-pass filtering or moving average to raw measurement values, but the filter time constant should not be too large, as it could mask real rapid contamination events. A sliding window of 10–30 seconds is a good starting point, adjustable based on on-site response requirements.
3. UI Layout and Visual Cues
The trend chart is the core component, recommended to provide three time windows: 1 hour, 24 hours, and 7 days. The current value should be displayed in a large font with its unit adjacent. Threshold alarms can use color changes (e.g., green for normal, yellow near threshold, red for exceeded), but colors must consider color-blind users, and icons can be used simultaneously. The maintenance status badge should be placed next to the sensor name, and data staleness prompts should be shown via timestamp + gray overlay, displaying 'data not real-time' when the communication timeout (e.g., 5 minutes) is exceeded.
4. Maintenance Status and Data Staleness Logic
The NSDD-Lite3 has no chemical consumables, but the optical window may accumulate biofilm or particle deposits from prolonged contact with water samples. Maintenance status can be triggered by device self-diagnostic flags, manual inspection records, or cumulative runtime. The UI should distinguish at least three levels: 'normal,' 'inspection recommended,' and 'immediate maintenance required.' Data staleness logic relies on the timestamp of the last successful communication: when communication is interrupted, retain the last valid value but reduce its visual weight and display the interruption duration, rather than continuing to present it as real-time data. For RS485 multi-node networks, a unique address must be assigned to each sensor, and the corresponding node number should be displayed in the UI to avoid cross-talk between multiple devices.
Limitations: On-site Screening is Not Equivalent to Laboratory Analysis
It is essential to clearly distinguish online sensors from compliant laboratory analysis methods. The NSDD-Lite3 is a reagent-free online spectral sensor suitable for trend monitoring, process optimization, equipment interlocking, and early warning, but it does not replace standard laboratory methods such as GB/T or EPA. The correlation between TOC, COD, and UV254 can vary with water sample matrix; after installation, on-site comparison with actual water samples should be performed to determine whether coefficients or calibration curves need adjustment. Turbidity, color, and bubbles can affect spectral measurements, so the display layer should retain an 'on-site validation' prompt or incorporate cross-checking with other sensors. Data trends are suitable for relative change judgments; instantaneous peaks should not be directly equated with process incidents, requiring comprehensive analysis of residence time, sampling point location, and system operating status. Furthermore, online sensors cannot distinguish specific organic species; the TOC/COD/UV254 response depends on organic composition. If new pollutants or cleaning agents are introduced into the process, the original correlation may become invalid and require revalidation.
Verification Methods
After completing integration, it is recommended to verify in the following order:
- Communication Verification: Use a serial debugging tool to check data frame integrity and checksum error rate.
- Display Consistency: Compare the UI displayed value with the raw register converted value to ensure unit conversion is error-free.
- On-site Comparison: Periodically collect parallel samples for laboratory analysis, and perform correlation analysis between laboratory results and online trends to confirm the sensor's applicability in the actual water quality.
- Extended Operation: Observe data drift, frequency of maintenance prompts, and UI performance under communication jitter.
- Usability Testing: Have non-expert operators test the system to see if they can quickly identify trend anomalies and understand maintenance prompts.
Frequently Asked Questions
Q: Can the NSDD-Lite3 display TOC, COD, and UV254 simultaneously? A: Yes. The sensor provides these parameters, and the UI can display them all at once, but it is recommended to prioritize them to avoid confusion. For example, use TOC as the primary trend, COD as an early warning aid, and UV254 as a process diagnostic.
Q: Why should temperature be displayed separately? A: Temperature is not only a measured value but also important context for explaining variations in other parameters. Rapid temperature fluctuations can alter solubility or optical characteristics, and displaying temperature helps distinguish real water quality changes from physical disturbances.
Q: How do I set up data staleness prompts? A: Record the timestamp of each successful read; when the difference between the current time and the last timestamp exceeds a preset threshold (e.g., 5 minutes), display 'data not real-time' on the UI and reduce the credibility of the value.
Q: Can the NSDD-Lite3 readings be used directly for environmental reporting? A: No. It is suitable for online screening and trend monitoring; final compliance data should be obtained using standard laboratory methods and per local regulations.
Q: Where do maintenance status prompts come from? A: They can be based on sensor self-diagnostic flags, communication quality, or manual inspection records. It is recommended to set maintenance reminders considering factors such as runtime and optical window cleaning records.
Q: If there is only one serial port, can multiple NSDD-Lite3 sensors be read simultaneously through the display? A: Yes, use RS485 bus with different addresses assigned, and the display polls the sensors. However, ensure the polling cycle matches the data staleness threshold.
Discuss your application
Tell us your target parameters, water matrix, interface and annual volume. Our engineering team will recommend a practical configuration.
Request a Quote