
In low-range COD sensor, TOC sensor and UV254 online monitoring projects, the most common problem is not that the sensor itself cannot detect a signal, but that unvalidated readings are treated as accurate values. The NSDD-Lite3 is a reagent-free, non-contact optical online water quality monitoring device that can be used for trend measurement and early warning in scenarios such as drinking water purification and industrial process water. However, to use it for determining filter life, process stability or equipment interlocking, credibility must be established through representative samples, time synchronization, temperature conditions, cleaning status and on-site correlation validation. The following methods are also applicable to multiparameter water quality sensors based on UV-Vis spectroscopy.
Why low-range projects must start with representative samples
Low range means readings are closer to background noise and baseline drift. Pipe dead zones, bubbles and sampling point location can all significantly affect results. The G1/2 process connection of the NSDD-Lite3 can be installed in pipes, tanks or bypass flow cells, but the installation location must represent the process water itself, not a stagnant branch pipe or a dead corner of a sampling valve.
For on-site validation, it is recommended to:
- When installing the sensor in a bypass, maintain continuous and stable flow through the bypass; avoid bubbles accumulating on the optical window.
- Laboratory samples should be collected from the same sampling port as the sensor or an immediately adjacent location, and the sampling time and sensor reading time should be recorded.
- If used for drinking water runoff monitoring, pay attention to flushing the sampling line; otherwise residual water will dilute or contaminate the current sample.
Only when the sensor measurement volume fully exchanges with the actual water body does subsequent laboratory comparison become meaningful.
Time synchronization: data without paired timestamps cannot be used for regression
In online water quality monitoring, it often takes several hours or even a day for a laboratory sample to be sent for analysis. If comparison is made only by date, pipeline transport delay, sample bottle storage time and analysis time will all introduce false deviations. For low-range validation, at least the following must be done:
- Sensor data records should carry timestamps, preferably using the same time source or a corrected clock as the sampling records.
- Record the lag time from the process point to the sensor and from the process point to the sample bottle. For slow bypasses, the lag time may be very long.
- Use the average value of stable sensor periods before and after sampling, rather than a single instantaneous value, to reduce the influence of flow fluctuations.
- If laboratory results require several hours, take the time-weighted average of stable sensor readings during that period and retain metadata such as temperature and cleaning status.
These time-series data are also the basis for evaluating cleaning cycles and baseline drift.
Impact of temperature conditions on UV/spectroscopic low-range measurements
The relationship between UV absorbance and organic matter concentration is affected by water temperature, background absorbance and optical window condition. The NSDD-Lite3 has built-in temperature correction, which can compensate to a certain extent for changes in the sensor optical components and sample temperature, but this does not mean that temperature records during external comparison can be ignored.
For on-site correlation validation, it is recommended to:
- Record the water temperature and the sensor internal temperature for each pair of sampling points.
- If the process water temperature varies greatly during the validation period, analyze correlation by segment rather than mixing all data into one curve.
- In the low-range range, baseline fluctuations caused by temperature may be greater than the change in the measured substance; when abnormal deviations are found, check the temperature trend first.
It must be clear: temperature correction is a device design feature and does not equal compliance with metrological regulations. Final usability is still determined by on-site paired data.
Cleaning status and optical window maintenance
The NSDD-Lite3 uses a non-contact optical structure and has no chemical reagent consumption, but the optical window may develop scaling, biofilm or particle deposition after long-term contact with water samples. For low-range projects, window contamination usually appears as a positive deviation or a slow baseline rise.
Cleaning validation should become part of every correlation validation:
- Record the sensor zero point or blank reading before and after cleaning to confirm that the window has returned to an acceptable state.
- Collect at least one pair of laboratory samples within the cleaning cycle to evaluate the impact of contamination on model deviation.
- For high-purity water or drinking water, the cleaning cycle may be longer than for wastewater, but it must be determined by on-site data rather than relying on a generic interval.
- Do not report data immediately after cleaning. Wait until the reading is stable and confirmed by a blank before resuming online monitoring.
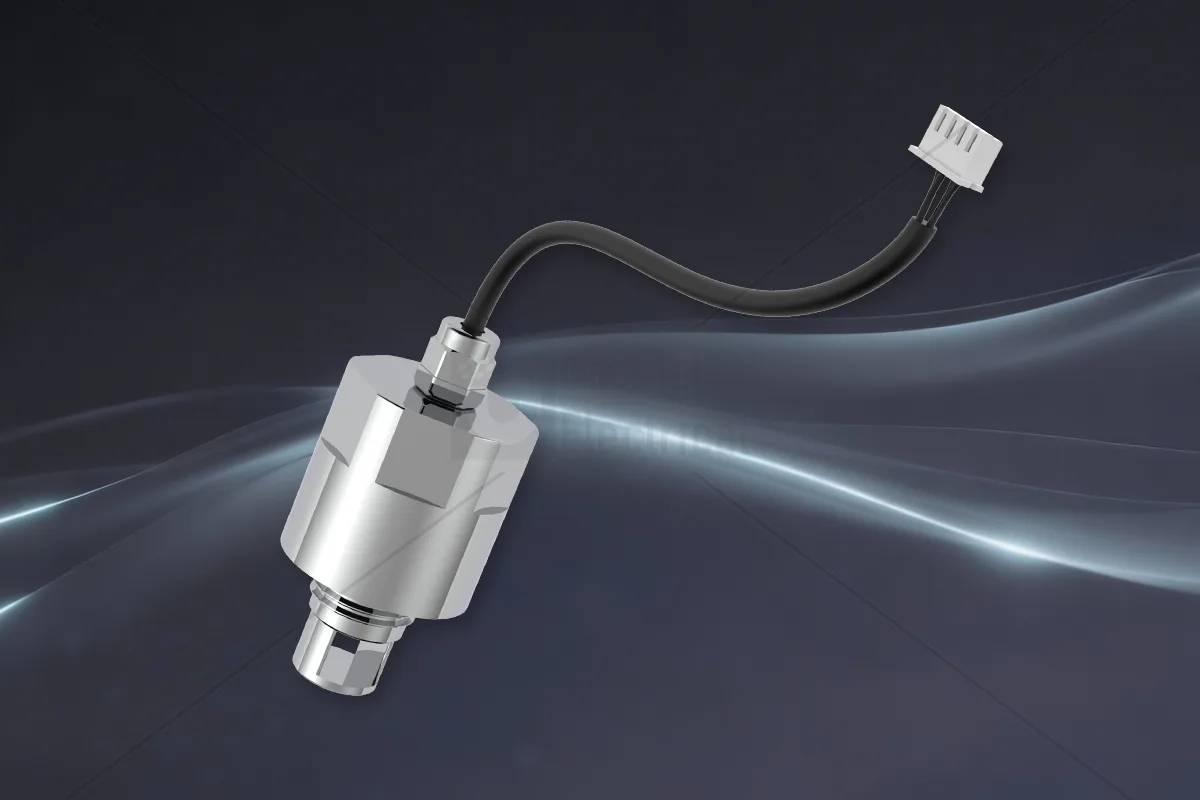
Cleaning is not a one-time task; it is a control variable for the long-term stability of low-range projects.
On-site correlation validation: turning a COD sensor from a displayed value into a credible trend value
The COD, TOC or UV254 given by online equipment is usually a spectral model prediction, not the direct result of a standard analytical method. On-site correlation validation is the most basic confirmation method. The steps are as follows:
- Preparation stage: Confirm the installation location, temperature probe, time synchronization and cleaning status; prepare laboratory sample bottles and record forms.
- Paired sampling: At multiple time periods covering the expected concentration range, collect laboratory samples from representative sampling points while recording stable sensor readings, temperature and cleaning status.
- Laboratory analysis: Analyze COD, TOC or UV254 according to laboratory standard methods, ensuring sample preservation and analysis conditions meet method requirements.
- Data processing: Create scatter plots and regression analysis of laboratory values versus sensor readings, checking the correlation coefficient, slope and intercept, and whether residuals vary with concentration.
- Model correction: If there is a stable systematic deviation, the on-site model can be improved through zero calibration or slope adjustment; if there are no adjustable parameters, establish a correction table or local conversion curve.
- Review and documentation: Record the validation date, temperature range, cleaning cycle, sample source and statistical results, and revalidate when conditions change.
Below is a common checklist that can be used for on-site project briefing:
| Validation item | Key requirement | Common error | On-site operation suggestion |
|---|---|---|---|
| Representative sample | Sample and sensor measure the same water body | Sampling from a dead-water branch pipe or residual water in a sampling valve | Flush the sampling line first and confirm continuous flow through the bypass |
| Time synchronization | Sensor and laboratory sample timestamps correspond | Comparing only by calendar day, ignoring lag | Use the same time source, record sampling and reading times |
| Temperature conditions | Record the process temperature for each pair of samples | Ignoring temperature changes, mixing data from different seasons | Regress by temperature interval or use temperature-compensated data |
| Cleaning status | Confirm the optical window both before and after cleaning | Using immediately after cleaning without confirming baseline | Observe blank/low readings after cleaning, then resume online |
| Correlation | Local paired data are required, not a default curve | Directly citing the manufacturer calibration curve as a compliance value | Review regularly and revalidate when water quality changes significantly |
Implementation steps: from acceptance testing to long-term quality control
- After installing the NSDD-Lite3, first check whether UART or RS485 communication and temperature readings are normal.
- Select a representative sampling point, establish a bypass or flow cell, and confirm that the pressure does not exceed the design pressure resistance range of 1.5 MPa.
- Determine the cleaning cycle and establish cleaning records; verify the optical window baseline after cleaning.
- Start a paired sampling plan covering at least the on-site minimum and typical concentration ranges; the specific number of samples is determined based on statistical power.
- Use paired data to evaluate correlation, form a local correction table or calibration coefficients, and write the method into the on-site operation document.
- Review monthly or quarterly, especially revalidate after changes in temperature, water quality source or treatment process.
Limitations: what conclusions cannot be drawn
The NSDD-Lite3 and similar multiparameter water quality sensors, even after completing on-site correlation validation, cannot replace standard laboratory analysis required by regulations. They are more suitable for online trend monitoring, abnormal warning, equipment interlocking and process optimization. The following conclusions should be avoided:
- Using sensor readings as the basis for discharge permit or drinking water compliance reports.
- Without validation, directly applying a local model for one water quality to a different water source or different industrial wastewater.
- In situations with high turbidity, strong color or obvious spectral interference, still treating UV method results as precise quantification.
- Believing that built-in temperature correction can completely eliminate temperature differences while ignoring temperature-related on-site validation records.
FAQ
Q: Can the low-range data from the NSDD-Lite3 COD sensor be used directly for environmental reports? A: No. The NSDD-Lite3 is a reagent-free optical online device suitable for trend monitoring and early warning. When compliance, enforcement or dispute handling is involved, laboratory standard methods (such as the dichromate method, TOC combustion method, etc.) and results from qualified laboratories should prevail. On-site validation only improves the credibility of the device readings; it does not change their regulatory status.
Q: During on-site validation, what time difference between laboratory samples and sensor readings is acceptable? A: There is no unified fixed value; the key is that the correspondence is clear. Sampling time, sensor averaging interval and pipeline lag time should be recorded, and the time difference should be minimized as much as possible. In low-range projects, it is best to use stable average readings within a few minutes before and after sampling, and avoid regressing samples from across hours or temperature periods together.
Q: Should online monitoring resume immediately after cleaning the optical window? A: Not recommended. After cleaning, let the sensor stabilize first, and confirm the baseline with blank water or a low-value water sample to avoid false readings caused by cleaning solution residue, bubbles or temperature changes. Once the window is confirmed clean and readings are stable, resume trend logging.
Q: Do the UV254 and COD and TOC measurements of the NSDD-Lite3 use the same measurement principle? A: The NSDD-Lite3 is a multispectral online water quality monitoring device that can provide TOC, COD, UV254 and temperature readings simultaneously. These parameters are usually derived from spectral absorbance models, and the conversion relationships between different parameters depend on water composition, so each project requires on-site paired data to verify the correlation curves.
Conclusion
Verification for low-range projects is not a one-time calibration but an ongoing quality control process. For online devices such as the NSDD-Lite3 COD sensor, TOC sensor and UV254 sensor, representative samples, time synchronization, temperature records, cleaning status and local correlation verification together determine whether readings can serve as trustworthy process variables. Only by clearly defining the boundary that the sensor is a screening tool can you avoid misusing on-site trend values as compliance data, while fully realizing its engineering value of reagent-free, non-contact and multiparameter output.
Discuss your application
Tell us your target parameters, water matrix, interface and annual volume. Our engineering team will recommend a practical configuration.
Request a Quote