
What Auto-Cleaning Solves: Typical Impact of Fouling on Trend Data
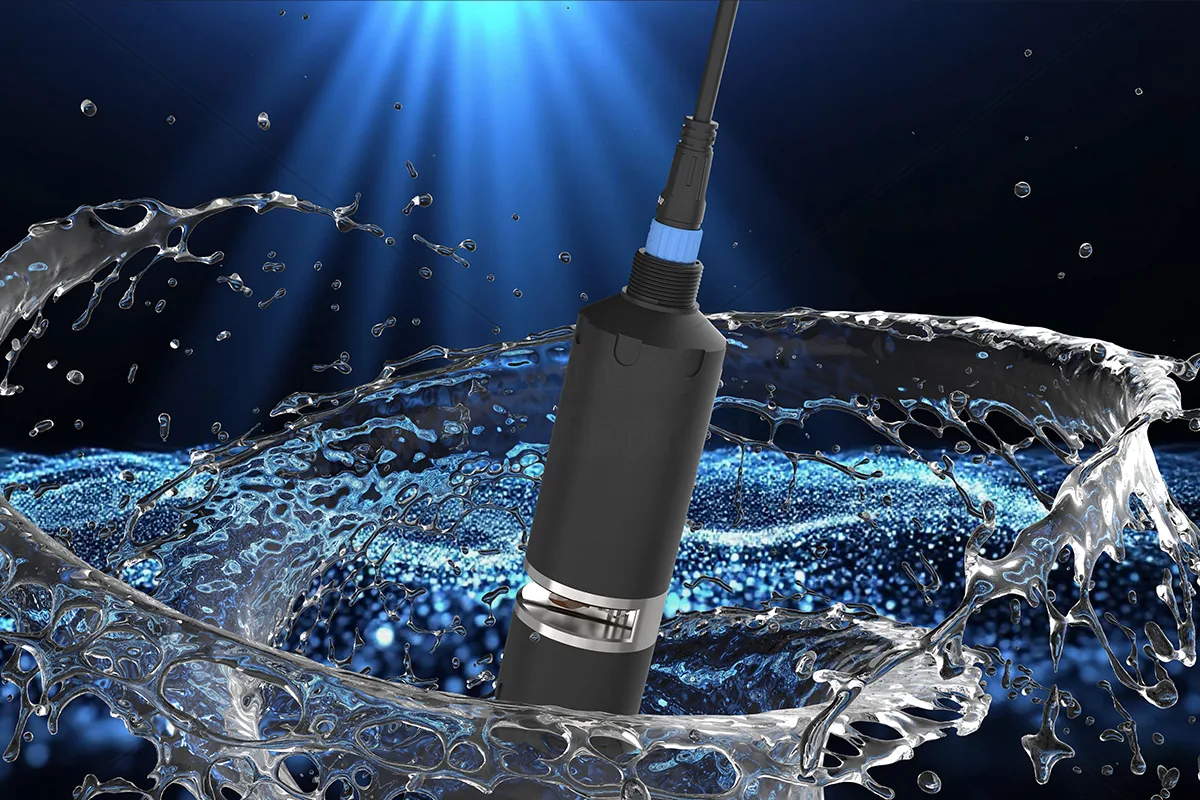
In continuous online water quality monitoring, the long-term data quality of a COD sensor (Chemical Oxygen Demand sensor) depends on two factors: the stability of the measurement principle itself and fouling control on the optical window. The NSDD6, as an industrial multi-spectral water quality sensor, uses non-contact spectral measurement and controls window fouling through auto physical cleaning. This article analyzes the boundaries of auto-cleaning effectiveness from a long-term trend perspective and provides a validation checklist for procurement and operations teams.
Biofilms, grease, and particulate matter attached to the optical window can cause light attenuation and scattering, resulting in slow drift or step changes in measurements. Auto physical cleaning periodically removes contaminants from the window surface, reducing baseline drift, extending maintenance-free intervals, and improving data continuity. However, auto-cleaning is not a catch-all: the cleaning action itself may cause momentary disturbances (mechanical vibration, bubbles, water flow changes), incomplete cleaning can leave residual films, and over-cleaning may wear the window (depending on design).
How COD Sensor Working Principle Couples with Auto-Cleaning
COD sensors typically operate on UV-Vis spectroscopy or fluorescence principles, building correlation models between spectral characteristics and COD values. The NSDD6 is a multi-spectral sensor that simultaneously outputs parameters such as TOC, COD, turbidity, color, UV254, and temperature. Auto-cleaning targets the optical window, not the internal optical path or electronic components. Therefore, cleaning can only control window fouling; it cannot correct calibration drift, model mismatch, or sample representativeness deviations.
In trend monitoring, the cleaning cycle and method (physical wiper, ultrasonic, air jet) affect data temporal resolution: data may be missing or flagged during cleaning, which must be identified during data processing. For multi-parameter monitoring with TOC sensors and UV254 sensors, the step response of cleaning events may also appear as inconsistencies between different parameters, which need to be distinguished in algorithms.
Validation Checklist: How Procurement and Operations Teams Can Assess Auto-Cleaning Effectiveness
| Validation Item | Method/Criteria | Frequency/Trigger |
|---|---|---|
| Baseline check before/after cleaning | Measure zero in clean, known low-turbidity water; observe whether reading returns to stable value after cleaning | Weekly or each maintenance |
| Data jump during cleaning events | Check cleaning markers in historical data; step amplitude should be below threshold | Auto-evaluate after each cleaning |
| Reference sample recovery | Compare with lab COD standard solution or actual water samples; calculate recovery within acceptable range | Monthly or per site requirements |
| Window fouling residue | Manually inspect window for biofilm, scratches, or residue | Periodic maintenance |
| Cleaning mechanism operation status | Confirm wiper/scrubber no wear, motor action normal | Quarterly |
| Data completeness | Calculate data gap duration due to cleaning; assess impact on trend smoothing | Monthly report |
The purpose of the above checklist is to distinguish between "cleaning effective" and "cleaning ineffective" states. If baseline still drifts after cleaning, or cleaning event jumps exceed thresholds frequently, adjust cleaning cycles or inspect the cleaning mechanism, rather than simply increasing data filtering strength.
Three Things Auto-Cleaning Cannot Replace: On-Site Maintenance, Reference Sample Verification, and Anomaly Diagnostics
Auto-cleaning reduces fouling frequency, but on-site periodic cleaning of peripherals, seal checks, and securing installation are still required. Reference sample verification is the only reliable way to correct spectral model deviations; auto-cleaning cannot correct model drift. Anomaly diagnostics require cross-validation with multiple parameters (turbidity, color, UV254) to distinguish real pollution events from sensor faults.
For surface water monitoring, turbidity and color fluctuations are large. Auto-cleaning can reduce manual maintenance frequency, but after heavy rain or high-turbidity events, attention is still needed for window residue and model applicability. For wastewater treatment, grease and activated sludge are stubborn; auto-cleaning may not completely remove them, so manual intervention remains necessary.
FAQ
Q: Is the COD sensor working principle affected by auto-cleaning? A: Auto-cleaning mainly acts on the optical window surface and does not affect the spectral measurement principle itself, but cleaning actions may cause brief disturbances that need to be flagged in data.
Q: Can auto-cleaning completely replace manual cleaning? A: No. Auto-cleaning can extend manual maintenance intervals, but it cannot handle stubborn scaling, internal contamination, or mechanical wear; on-site manual inspection is still essential.
Q: In long-term trend monitoring, how do you distinguish cleaning-induced jumps from real water quality changes? A: Use cleaning event markers, multi-parameter comparison, and lab reference sample verification to avoid misinterpreting cleaning steps as pollution events.
The value of auto-cleaning for long-term water quality trends lies in improving data continuity and reducing drift risk, but its effectiveness must be evaluated under an on-site validation checklist and cannot replace calibration and diagnostics.
Discuss your application
Tell us your target parameters, water matrix, interface and annual volume. Our engineering team will recommend a practical configuration.
Request a Quote