
How NSDD6 Color Trends Support Industrial Wastewater Investigation
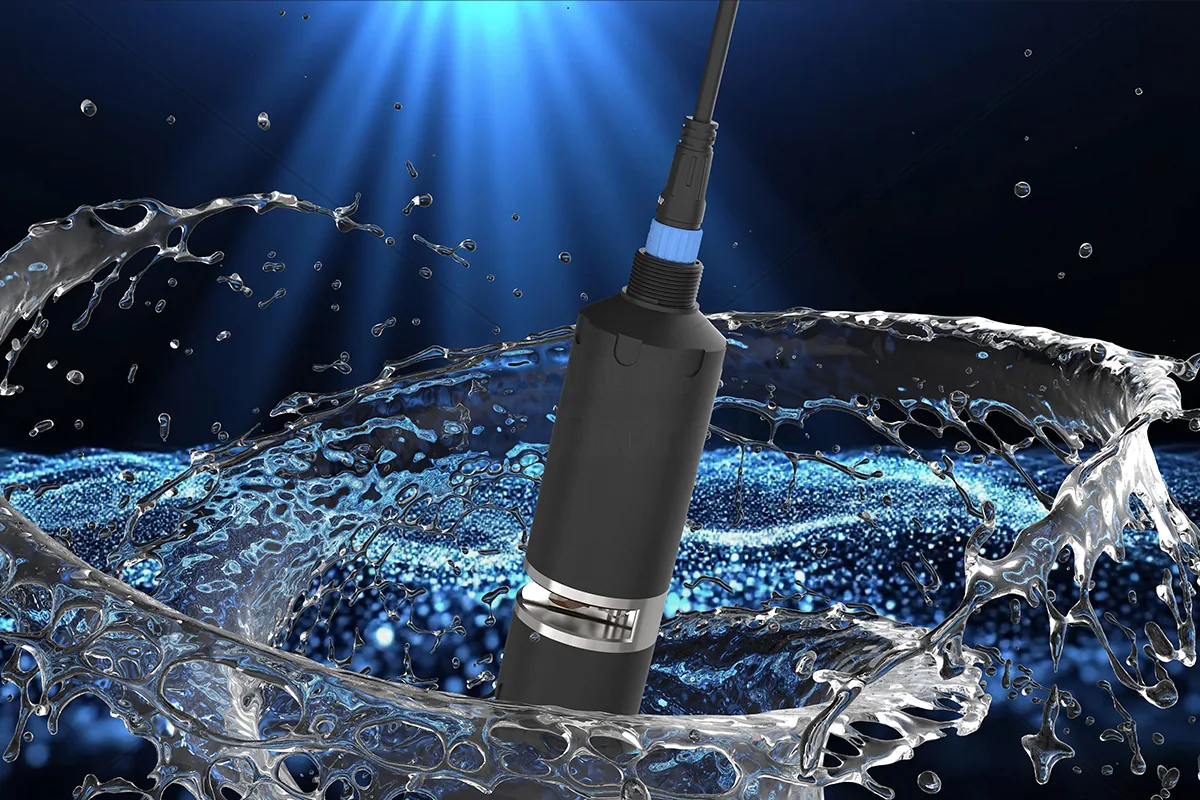
Industrial wastewater investigation often faces intermittent influent shocks, process batch leaks and unidentified colored wastewater mixing in. As a high-frequency, intuitive warning signal, online color trends can help engineers quickly narrow the investigation time window. The NSDD6 industrial multiparameter water quality sensor simultaneously outputs color, COD, TOC, UV254, turbidity and temperature, providing multi-parameter cross-validation for on-site screening, but it must be made clear: online trends are a screening tool and cannot replace laboratory standard analysis.
Why Color Trends Suit Industrial Wastewater Investigation
In many industrial wastewaters, color changes often appear in sync with process anomalies. For example, dye or pigment residues, metalworking fluid leaks, cleaning agent discharges, and mixing in of high-color wastewater from food processing can all cause color to show obvious steps or spikes within a short time. Compared with manual timed sampling, online sensors can continuously record color changes, making it easier to capture intermittent, short-duration discharges.
More importantly, color can complement organic-matter indicator parameters. When color rises but COD sensor, TOC sensor and UV254 sensor trends do not rise in sync, it may be colored but hard-to-oxidize substances entering; when color rises together with UV254 and COD trends, it is more likely a genuine increase in organic pollution load. This cross-interpretation helps determine whether an anomaly is optical interference, a matrix change or a real pollution event.
How NSDD6 Produces Color and Organic-Matter Trends
The NSDD6 uses non-contact spectral measurement, consumes no chemical reagents during measurement, and features automatic physical cleaning, making it suitable for long-term online operation at industrial sites. Its multispectral design can output color, COD, TOC, UV254, turbidity and temperature trends, and connects to PLC, SCADA or a host computer via an RS485 digital interface for continuous recording and alarming.
In practical investigation, color trends can serve as a "first-layer screen": after operations personnel set trend thresholds or slope alarms, the system can automatically alert when an anomaly appears. Engineers then combine COD sensor, TOC sensor and UV254 sensor data from the same period to determine whether it is an organic load shock. This multi-parameter online water quality monitoring mode is more reliable than a single parameter.
Identifying Process Batches and Influent Changes from Color Trends
Many discharges in industrial wastewater have clear temporal characteristics. By continuously recording color curves, engineers can observe whether there are periodic peaks synchronized with production batches. For example, if a certain cleaning process discharges high-color wastewater every two hours, the color curve will show regular spikes; if the raw materials or chemicals used in a batch change, the height, width or timing of color peaks may shift. Comparing these trends with the manufacturing execution system (MES) or manual logs can quickly pin down the anomalous batch.
Other influent changes are related to rainfall, seasonal production or discharges from upstream companies. Color trends can record these slow changes, helping determine whether to adjust pretreatment chemical dosing, retention time or reflux ratio. Note that color itself is not equivalent to pollutant concentration, so any adjustment based on color trends should be supported by multi-parameter trends such as COD sensor, TOC sensor and UV254 sensor, and regularly verified through laboratory analysis.
Deployment Locations and Investigation Objectives
In industrial wastewater investigation, the NSDD6 can be installed at different locations, and trends at different locations have different meanings:
- Influent or before the equalization tank: used to capture upstream influent shocks, suitable for early warning and source tracing.
- After pretreatment: used to evaluate the removal effect of coagulation, air flotation, oxidation and other pretreatment units on color and organic matter.
- Biochemical tank effluent or before the discharge outlet: used to observe whether the final effluent shows abnormal fluctuations, assisting discharge risk management.
Color trends at different locations require different interpretation logic. For example, an influent color spike may be an external shock, while a slow rise in effluent color may indicate reduced biological treatment efficiency or a change in sludge age. Judgment must be made comprehensively in combination with the process flow and online water quality monitoring data.
Three Necessary Conditions for Data Interpretation
Matrix Effects
The background absorption spectra of different industrial wastewaters vary greatly, and the same color value may correspond to completely different organic matter concentrations in different influents. For example, the relationship between color and COD in papermaking wastewater, printing and dyeing wastewater, electroplating wastewater and food wastewater is not universally applicable. Therefore, a fixed "color-COD" conversion factor cannot replace COD sensor calibration or laboratory testing.
Optical Interference
Online optical sensors are susceptible to bubbles, suspended particles, biofilm and optical window contamination. Strong color itself may also produce nonlinear absorption of the UV-visible spectrum, causing false changes in UV254 or COD trends. The automatic physical cleaning of the NSDD6 can mitigate some contamination interference, but cannot completely eliminate the effects of high-concentration particulate matter or oil films.
Manual Review
Any online trend anomaly requires manual review. Review content includes: checking on site whether the sensor is clean, whether water flow is normal, and whether it is under maintenance; retrieving other parameter curves from the same period; checking production schedules, raw material changes, cleaning cycles and rainwater discharge records; and sampling for laboratory standard method analysis when necessary. Only after manual confirmation and laboratory verification can trend data be turned into reliable investigation conclusions.
Implementation Steps: How to Conduct Investigation Using Color Trends
- Establish a baseline: run continuously for at least several production cycles under normal conditions, recording time series of color, COD, TOC, UV254, turbidity and temperature to understand the normal fluctuation range.
- Set trend rules: based on historical data, set reasonable trend thresholds, rate-of-change or duration alarms to avoid excessive false alarms from being too sensitive.
- Correlate with production events: when an abnormal trend appears, compare the timestamp with production logs, shift schedules, cleaning cycles and raw material batches to look for possible discharge sources.
- On-site confirmation: check sensor status, sampling ports and piping conditions to confirm the anomaly is not a false alarm caused by equipment maintenance or cleaning cycles.
- Laboratory verification: test water samples from suspicious periods using standard methods, and make a comprehensive judgment in combination with online data from the COD sensor, TOC sensor and UV254 sensor.
Comparison of Online Trend Screening and Laboratory Discharge Analysis
| Dimension | Online trend monitoring | Laboratory discharge analysis |
|---|---|---|
| Purpose | Real-time warning, trend tracking, rapid location of anomalous periods | Compliance determination, enforcement basis, precise concentration measurement |
| Response speed | Continuous or high-frequency, minute-level | Hours to days after sampling |
| Data status | Screening and indication, cannot be used alone for regulatory reports | Legal results under standard methods |
| Interference handling | Relies on automatic cleaning, multi-parameter cross-validation and manual review | Laboratory pretreatment, quality control, certified reference material calibration |
Limitations and Applicability Boundaries
- The online color and organic-matter trends of the NSDD6 are used for on-site screening and process diagnosis and are not a regulatory-recognized discharge monitoring method.
- Different industrial wastewater matrices vary greatly, requiring on-site comparison and model adjustment for specific scenarios; parameters from other plants cannot be directly applied.
- Temperature changes, strong color, high turbidity, oil films and chemical interference may all affect optical measurement, and must be evaluated in combination with temperature trends and manual maintenance records.
- A color trend anomaly cannot by itself determine the type of pollution; source tracing must rely on laboratory analysis and production information.
FAQ
Q: Does a color trend alarm mean the discharge exceeds standards?
A: Not directly equivalent. Online color trends are only used for early warning and investigation; whether standards are exceeded must be based on the results of laboratory standard methods.
Q: Why is the same color curve interpreted differently at different plants?
A: Because the matrices and chromophoric substances of different industrial wastewaters differ, and the relationship between color and COD or TOC varies greatly. Interpretation rules must be established based on the plant's historical data and laboratory comparisons.
Q: Can the NSDD6 replace a COD sensor or TOC sensor?
A: The NSDD6 itself can output optical indicator trends such as COD, TOC and UV254, but these are multispectral estimated trends that require on-site comparison for confirmation. It is better suited as a multi-parameter trend screening tool rather than a replacement for laboratory analysis or regulatory monitoring.
Discuss your application
Tell us your target parameters, water matrix, interface and annual volume. Our engineering team will recommend a practical configuration.
Request a Quote