
# How to Handle Deviations Between NSDD6 and Grab Sample Comparisons: On-Site Troubleshooting Methods for COD Sensors
In real-world projects, comparing the COD, TOC, or UV254 data output by the NSDD6 multiparameter water quality sensor with laboratory grab sample results is common practice. When deviations occur, directly concluding that the "sensor is inaccurate" or adjusting factory coefficients often masks the underlying problem. A more reliable approach is to first troubleshoot one by one according to time synchronization, sample handling, sampling location, temperature, matrix, and sensor status, and then decide whether local calibration or remodeling is needed.
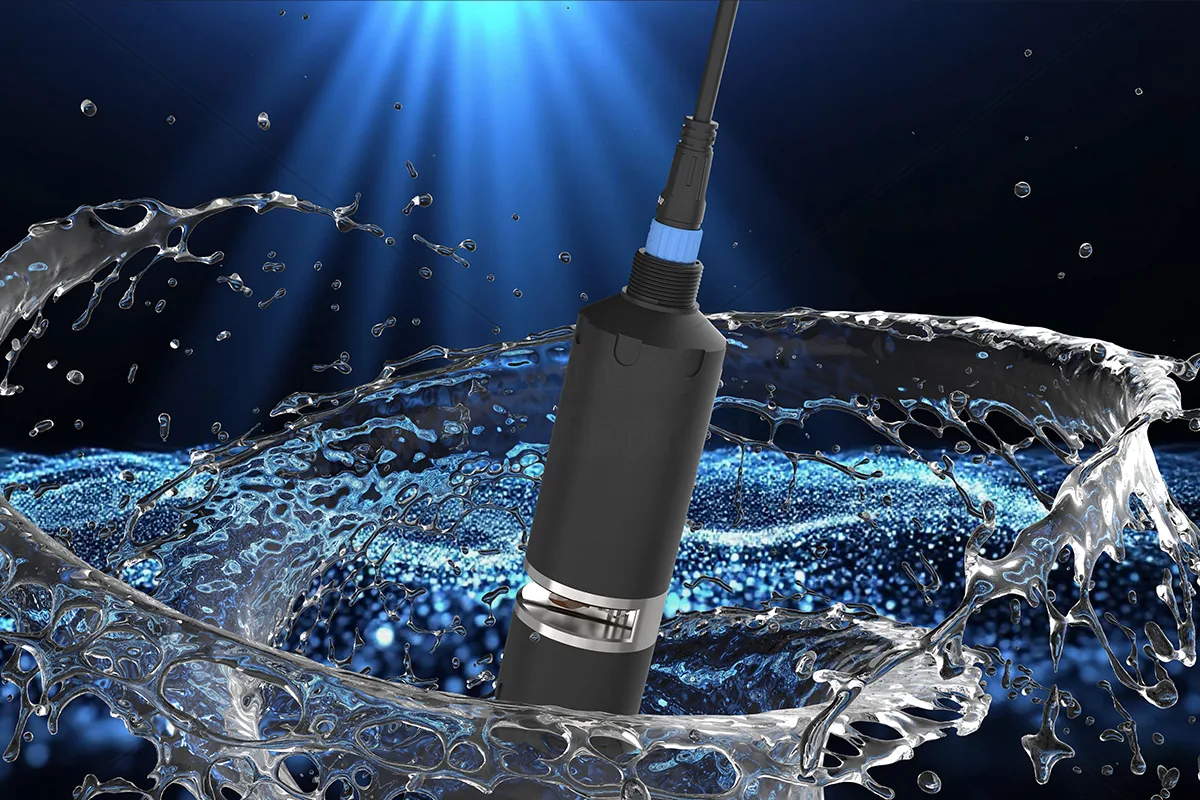
The NSDD6 is a reagent-free, non-contact spectral measurement device with automatic physical cleaning, capable of continuously outputting up to six parameters: TOC, COD, turbidity, color, UV254, and temperature. Its positioning is on-site screening and trend monitoring, not replacing laboratory chemical oxygen demand analysis. In wastewater treatment and surface water online water quality monitoring projects, understanding this boundary helps ensure reasonable use of the data.
Why Inherent Differences Exist Between COD Sensors and Laboratory Methods
Laboratory COD typically uses the dichromate method (such as HJ 828 or similar standards), measuring the amount of oxidizable substances in a water sample through a strong oxidant under high-temperature reflux. The NSDD6, as a COD sensor, uses the characteristic absorption of the water sample in the UV-visible band to indirectly estimate the comprehensive organic matter indicator through a built-in model. The two have different principles and different response targets: one measures chemical oxidation capacity, the other measures optical response. Therefore, in complex matrices, even if the equipment is fully functional, numerical differences may occur. This is not a fault signal, but an indication that localized correlation validation is needed.
Deviation Troubleshooting: Perform Six Checks First
1. Time Synchronization and Sampling Moment
Do the grab sample record time and the sensor data timestamp match? If the water sample is left for a long time after collection before being sent to the laboratory, while the sensor reads the water quality at the moment of sampling, the time lag will cause deviations. Recommendations:
- Check the collection time against the sensor log time, accurate to the minute.
- Retrieve the sensor trend 10–15 minutes before and after the sampling time. If the signal itself fluctuates greatly, single-point comparison is of limited value.
- If using an automatic sampler, confirm whether the sampling interval, sample volume, and sensor output averaging period match.
- If the sensor data has built-in averaging or smoothing, use the average value over the same time window to correspond with the laboratory sample, rather than the instantaneous value.
2. Sample Handling and Laboratory Error
Laboratory grab samples themselves may be affected by sampling bottles, preservatives, transport temperature, and homogenization degree. Confirm:
- Were preservatives added to the samples according to standards and analyzed within the specified time?
- Was the sample fully mixed? If a water sample containing suspended solids is left to settle and the supernatant is taken, laboratory COD will be lower; while the sensor measuring the original mixed water may show systematic deviation.
- Was masking or dilution performed for high-chloride wastewater? Chloride ions consume oxidant, causing falsely high laboratory COD.
- What is the reproducibility between parallel samples of the same water sample or between different laboratories? First rule out laboratory issues before questioning the sensor.
- If the laboratory uses different methods (such as permanganate index and dichromate method), the two are not directly comparable, and the method should be unified.
3. Sampling Location and Sensor Installation Location
If the NSDD6 is installed in a bypass flow cell or sampling pipe, the water sample needs time to reach the sensor, and sedimentation, wall adhesion, or biofilm may occur in the pipe. Confirm:
- Whether the sensor location and the manual grab sampling point are in the same flow field and at the same depth.
- Is the bypass flow rate sufficient? Too low a flow rate will cause suspended solids to deposit, making the water seen by the sensor different from the main pipe.
- Is there aeration, recirculation, short-circuiting, or dead zones? These can change local water quality.
- If the sensor is in an open channel or tank, the grab sampling point should be as close as possible to the sensor probe optical window position.
- Check whether the sampling pipe material adsorbs organic pollutants; a sampling pipe that has not been cleaned for a long time can become a pollution source.
4. Temperature Effects
Water temperature changes alter spectral absorption characteristics and also affect laboratory COD reaction rates. The NSDD6 has temperature measurement capability, but the model's temperature compensation range should match actual operating conditions. After significant seasonal water temperature changes, if the deviation direction is consistent, consider:
- Check whether the sensor temperature reading is reasonable, compare with a portable thermometer.
- Observe whether the deviation is linearly correlated with temperature; if correlated, it may be necessary to collect samples from different temperature ranges to re-validate the model.
- Temperature changes during sample transport and storage may also affect results; record the sample receiving temperature.
5. Matrix Changes and Model Applicability
Optical COD/TOC models are typically established based on statistical relationships for specific water quality. When influent composition changes (such as rainy season dilution, industrial shock, changes in return flow ratio), the original model may no longer be applicable. The NSDD6 simultaneously measures turbidity, color, and UV254, which can help determine whether the matrix has changed:
- If turbidity, color, or UV254 show significant anomalies, it indicates that the particulate or dissolved organic matter composition in the water may have changed, and the COD output may also shift accordingly.
- At this point, multiple sets of grab samples under the new operating conditions should be collected for local consistency checks, rather than continuing to use old coefficients.
- Note that high-turbidity or high-color water samples may exceed the linear range of the optical sensor, causing output saturation or nonlinear deviation.
6. Sensor Fouling and Optical Window Condition
Although the NSDD6 has automatic physical cleaning, after long-term operation, the optical window may still have mineral scaling, oil film, or biofilm edge residue. Fouling can cause signal attenuation or drift. Troubleshooting steps:
- Check whether the sensor historical curve shows slow monotonic drift or sudden steps.
- Stop operation to inspect the optical window, clean with a soft cloth and clean water, and observe whether the data recovers.
- Check whether the wiper mechanism operates normally, and whether there is wear or jamming.
- If the deviation is eliminated after cleaning, fouling is the main cause; otherwise, continue analyzing other factors.
- Regular maintenance records help identify fouling cycles, thereby optimizing cleaning frequency.
The table below summarizes six common deviation sources and corresponding troubleshooting actions:
| Deviation Source | Typical Manifestation | Troubleshooting Action |
|---|---|---|
| Time asynchrony | Large sensor data fluctuation around sampling | Check timestamps, retrieve instantaneous value at sampling moment |
| Sample handling differences | Laboratory parallel samples scattered or large deviation between methods | Check preservation, homogenization, filtration, and chloride interference |
| Location inconsistency | Sensor readings stable but grab sample taken elsewhere | Confirm flow path, bypass retention, depth, and mixing degree |
| Temperature changes | Consistent deviation direction after seasonal changes | Record temperature, evaluate temperature compensation and model range |
| Matrix changes | Deviation increases after influent composition changes | Collect recent grab samples for local model validation |
| Sensor fouling | Slow drift or sudden change in data | Inspect/clean optical window, compare before and after cleaning |
Positioning of On-Site Screening and Laboratory Analysis
The NSDD6 in online water quality monitoring is a continuous trend monitoring tool, with advantages of high frequency, real-time, and reagent-free, suitable for wastewater treatment process optimization, influent/effluent comparison, and anomaly warning. Laboratory grab samples are the reference method for compliance scenarios such as enforcement monitoring and discharge permits. The two should not replace each other, but be used in parallel: the sensor provides process dynamics, and laboratory data is used for periodic verification and model correction.
Establish a Local Comparison and Validation Process
Adjusting sensor calibration coefficients based on a single grab sample comparison is very risky. It is recommended to establish a sustainable validation mechanism according to the following steps:
- Collect representative samples: Simultaneously collect at least 10 samples covering different concentrations and operating conditions next to the sensor measurement point, recording sensor readings and time.
- Laboratory analysis: Determine COD, TOC, and other indicators according to standard methods, and retain sample pre-treatment records.
- Data pairing: Pair sensor output with laboratory results using time as the key, and remove obvious outliers.
- Deviation analysis: Calculate mean deviation, relative error, and linear correlation coefficient, and observe whether there is systematic offset.
- Decision: If the deviation is within the project's acceptable range, maintain parameters and set a regular verification plan; if there is a stable systematic deviation, consider refitting the model with local data, but retain historical data and version records; if the deviation is irregular, prioritize checking sampling and sensor installation rather than adjusting the model.
Implementation Recommendations and Limitations
- The NSDD6 output is a model-estimated value, not a COD/TOC report value in the sense of laboratory methodology; it can be directly referenced for internal control and early warning, but for external reporting, laboratory data should prevail.
- Automatic physical cleaning of the sensor can reduce maintenance frequency, but cannot completely eliminate manual inspection; it is recommended to determine the cleaning cycle based on the degree of on-site fouling.
- Local calibration should be based on a sufficient number of representative samples and periodically rechecked with new grab samples.
- If deviations originate from high turbidity, high color, or special industrial wastewater, and the model does not include such matrices, data should be interpreted with caution, and laboratory testing frequency increased if necessary.
- NSDD6 uses a 316L stainless steel and POM industrial structure with isolated RS485 communication, making it suitable for long-term deployment. However, electrical grounding and power supply stability can also affect data reliability and should not be overlooked during troubleshooting.
FAQ
Q: Can NSDD6 directly replace laboratory COD testing? A: No. NSDD6 is a reagent-free spectral sensor used for continuous COD/TOC trend monitoring and early warning; its output is a model-estimated value and does not have the legal status of the laboratory dichromate method. Compliance reporting still requires laboratory grab samples.
Q: How large a deviation is considered normal? A: There is no universal value. The allowable deviation depends on the specific water quality, the sensor's local calibration status, and the project's risk control requirements. The reasonable fluctuation range for the site should be determined through multiple sets of synchronized comparisons, rather than applying a fixed percentage to all scenarios.
Q: What should be done if the deviation remains large after cleaning the sensor? A: First check sampling representativeness, time synchronization, and laboratory data quality; then check the bypass flow path, temperature, and matrix changes. If external factors are ruled out, use multiple recent data sets to assess whether local remodeling is needed.
Q: Can the automatic cleaning of NSDD6 completely prevent contamination? A: Automatic physical cleaning can reduce the effects of biofilm and particle adhesion, but long-term operation still requires regular manual inspection of the optical window and wiper mechanism. Especially in water with high hardness, high grease content, or high biological activity, the maintenance interval should be shortened accordingly.
Discuss your application
Tell us your target parameters, water matrix, interface and annual volume. Our engineering team will recommend a practical configuration.
Request a Quote