
Why Secondary Clarifier Effluent Requires Trend Monitoring
The secondary clarifier is the final step of the activated sludge process, and its effluent quality directly determines the load on discharge or advanced treatment units. Conventional operation relies on daily or per-shift grab samples, but these reflect only the sampling instant and can miss short-term shocks, nighttime peaks or slow process drift. Online water quality trend monitoring uses high-density data to connect points into lines, helping operators detect anomalies early, determine sources and evaluate adjustments.
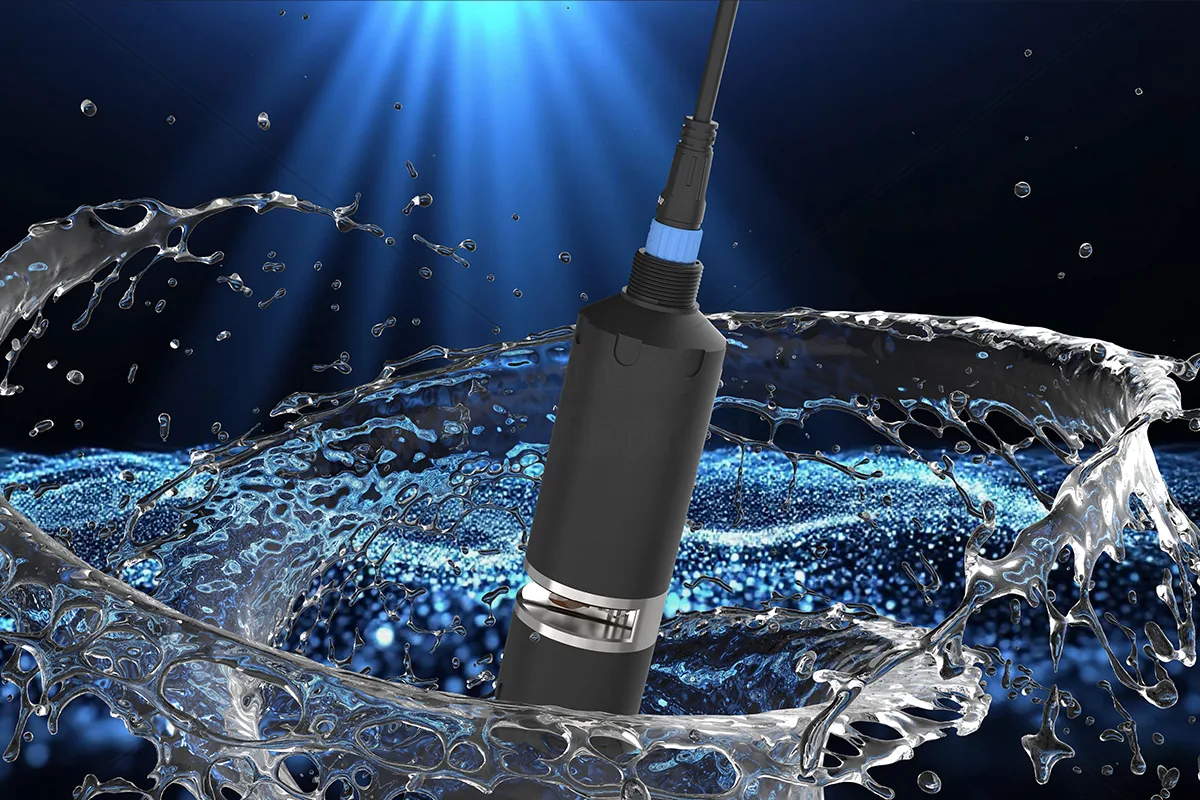
The NSDD6 industrial multiparameter water quality sensor uses non-contact spectral measurement, requires no chemical reagents, and continuously outputs TOC, COD, turbidity, color, UV254 and temperature. In secondary clarifier effluent monitoring, the combined trends of these parameters are more diagnostic than any single value. For example, a change in the COD-to-TOC ratio may indicate a shift in the proportion of dissolved versus particulate organic matter; simultaneous increases in turbidity and UV254 often point to deteriorating sludge settling or hydraulic shock.
How Trend Monitoring Supports Operational Checks
Continuous monitoring data's core value is not replacing laboratory analysis but providing the process of change. By observing trend curve slopes, fluctuation periods and synchronicity, operators can quickly identify the problem type:
- Continuous slow rise: may reflect excessive sludge age, intensified endogenous respiration, or long-term high influent loading.
- Periodic fluctuations: often related to daily variations in influent flow or quality, such as morning/evening peaks or intermittent industrial discharges.
- Spike-like sudden changes: mostly caused by rainfall inflow, abnormal return sludge, brief equipment failure or shock loading.
- Synchronized anomalies in multiple parameters: e.g., simultaneous increases in COD, turbidity and temperature may indicate sludge bulking or denitrification floating in the secondary clarifier.
Trend monitoring also verifies operational measures. For example, after adjusting sludge return ratio or wasting volume, continuous data can show effects within hours, while grab samples may take days to confirm a trend.
Combining Sludge Conditions, Rainfall, Maintenance and Grab Samples to Determine Change Sources
Trend curves alone cannot establish causation; on-site information must be cross-checked. A four-step assessment process is recommended:
| Step | Check Content | Associated Signal | Interpretation |
|---|---|---|---|
| 1 | Sludge condition | Sludge settling ratio, sludge volume index, microscopic examination | Sludge aging or bulking often accompanies a slow rise in effluent COD and turbidity fluctuations |
| 2 | Rainfall data | Rainfall duration, intensity, sewer network inflow | Effluent COD and turbidity spikes after rainfall indicate combined sewer overflow or first flush shock |
| 3 | Maintenance records | Equipment cleaning, calibration, process adjustment times | When trend changes coincide with maintenance times, rule out sensor contamination or calibration drift |
| 4 | Laboratory grab samples | Reference values for COD, TOC, turbidity, etc. | Grab samples verify online data accuracy and determine absolute concentration levels |
When trends show anomalies, troubleshoot in this order:
- Confirm sensor status: check whether automatic physical cleaning is working properly and whether the optical window has scaling or bubbles.
- Synchronized sampling: take a grab sample near the sensor installation point, send it to the laboratory for analysis, and compare with online data.
- Trace back process events: check recent adjustments to aeration rate, return ratio, wasting volume, or any equipment shutdowns.
- Consider external factors: confirm whether there was rainfall, illegal industrial discharge or sudden influent quality changes.
NSDD6 Technical Features and Applicability
NSDD6 is designed for surface water, industrial and domestic wastewater, treatment plant effluent and discharge monitoring. Key features include:
- Non-contact spectral measurement: no contact with the water sample, avoiding direct impact of optical window contamination and eliminating reagent consumption.
- Automatic physical cleaning: supports long-term field deployment, reduces manual maintenance, and suits high-suspended-solids environments like secondary clarifiers.
- Multiparameter coordinated output: one sensor provides TOC, COD, turbidity, color, UV254 and temperature, cutting multi-sensor installation costs and data synchronization issues.
- Industrial-grade construction and communication: 316L stainless steel and POM materials, long-distance isolated RS485 communication, easy integration with existing SCADA or data platforms.
For secondary clarifier effluent monitoring, the typical NSDD6 installation location is the effluent weir or collection channel, ensuring continuous water flow through the measurement area. Because it uses spectroscopy, the sensor does not directly measure absolute chemical oxygen demand concentration; instead, it establishes a correlation model between spectral features and laboratory COD. Therefore, on-site deployment requires calibration and verification specific to that wastewater treatment plant.
Implementation Steps
- Installation positioning: choose a location in the secondary clarifier effluent channel or collection channel with stable flow and even suspended solids distribution, avoiding dead zones and strong turbulence.
- Initial calibration: continuously collect at least one week of online data while simultaneously collecting laboratory reference water samples to establish a local calibration model. Water quality varies greatly between seasons, so staged calibration is recommended.
- Data integration: connect the sensor to a PLC or data acquisition system via RS485, and set a reasonable sampling frequency (e.g., every 5–15 minutes).
- Maintenance plan: set the automatic cleaning cycle according to water turbidity and scaling conditions, and periodically check cleaning effectiveness manually.
- Verification and adjustment: compare with laboratory grab samples at least monthly; if deviation exceeds the acceptable range, recalibrate or check sensor status.
Limitations and Applicability Boundaries
NSDD6 is a trend monitoring and early warning device and cannot replace laboratory standard methods (e.g., GB 11914 or HJ 828 for COD determination). Limitations include:
- Optical interference: high color, high turbidity or specific dissolved organic matter may affect spectral interpretation; local calibration reduces errors.
- Temperature influence: water temperature changes may affect spectral response; although the sensor has temperature compensation, verification is still needed under extreme temperatures.
- Maintenance dependence: despite automatic physical cleaning, regular manual cleaning is still needed in high-oil or high-biofilm environments.
- Correlation limitations: the sensor's COD value is estimated from a model built with local water samples. When wastewater composition changes significantly (e.g., industrial wastewater proportion changes), the model may fail and require recalibration.
Compliance monitoring must use laboratory analytical methods; online sensors are only for process control and trend early warning.
Verification Methods
Effective verification builds trust. Recommended measures:
- Regular laboratory comparison: collect a grab sample weekly or biweekly, compare with sensor readings from the same period, and plot a deviation curve.
- Multipoint calibration: collect data under different seasons and loading conditions to build models and improve adaptability.
- Cross-verification: compare with another independent sensor or portable instrument to rule out single-point failure.
- Data integrity check: monitor communication interruptions, cleaning cycles and abnormal data jumps to ensure data reliability.
FAQ
Q: Can NSDD6 COD measurements be used directly for discharge reporting?
A: No. NSDD6 is for trend monitoring and process control; its data is for internal reference only. Discharge compliance must rely on laboratory standard methods.
Q: Why do online COD and laboratory COD sometimes disagree?
A: The two principles differ. The online sensor is based on spectroscopy and estimates through a model; the laboratory uses chemical digestion. Changes in wastewater composition, particulate interference or sensor contamination can cause deviations, requiring regular calibration and verification.
Q: In secondary clarifier effluent monitoring, which parameter combinations best reflect problems?
A: Typically focus on the COD-to-TOC ratio, turbidity, UV254 and temperature. For example, a rising COD/TOC ratio may indicate increased refractory organic matter, and simultaneous increases in turbidity and UV254 often suggest deteriorating sludge settling or hydraulic shock.
Discuss your application
Tell us your target parameters, water matrix, interface and annual volume. Our engineering team will recommend a practical configuration.
Request a Quote