
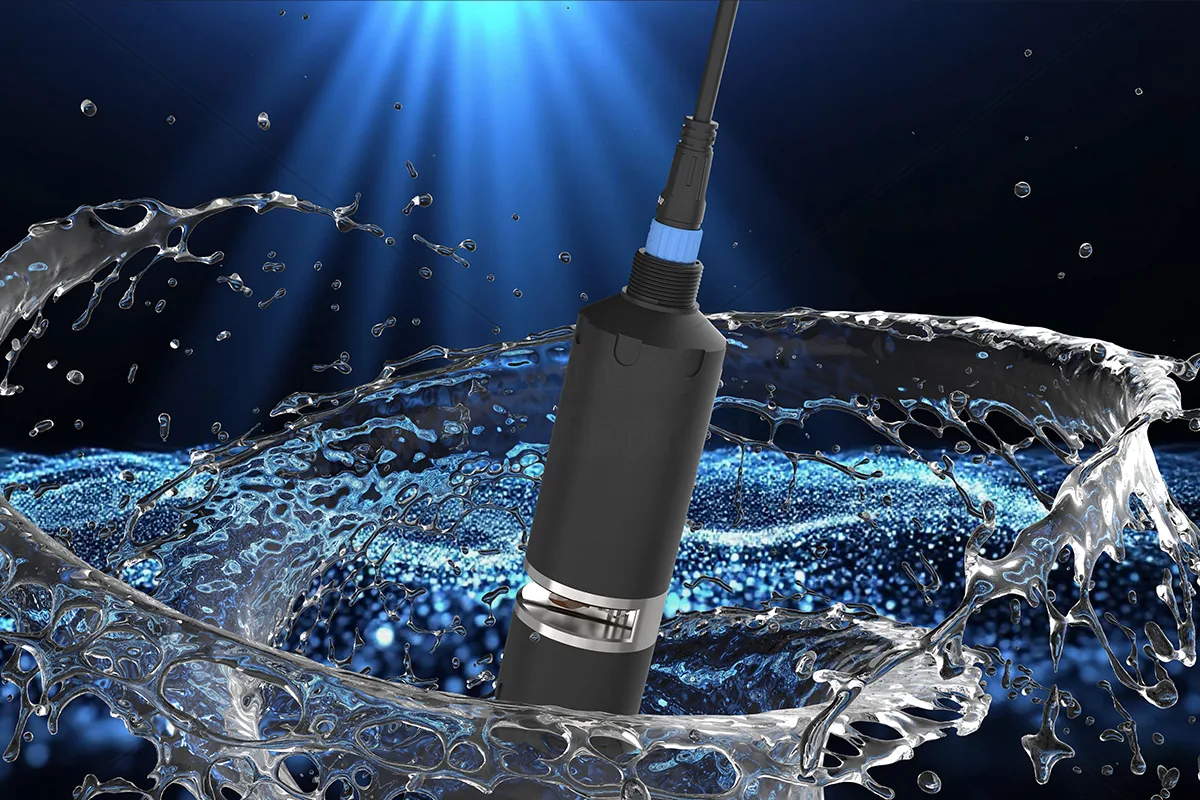
In online monitoring for water treatment plants and industrial process water, it is common to deploy separate COD sensors, TOC sensors, UV254 sensors, turbidimeters, and colorimeters. The NSDD6 industrial multispectral water quality sensor uses non-contact spectral measurement, requires no chemical reagents, and relies on automatic physical cleaning to control fouling. It simultaneously outputs up to six parameters: TOC, COD, turbidity, color, UV254, and temperature. This allows direct comparison of multiple water quality trends in the same time series. However, it must be clear that these online signals are for field screening and trend monitoring, not direct substitutes for laboratory compliance testing.
Why Choose Multispectral Instead of Multiple Single-Parameter Sensors?
In traditional setups, different parameters often come from separate instruments of different brands, sampling points, and timestamps. Even if each instrument is accurate, combining them for process diagnostics can introduce timing misalignment and sampling representativeness issues. The NSDD6 integrates multiple optical trend parameters behind the same non-contact measurement window, output from the same measurement cycle, reducing uncertainty from time desynchronization.
For scenarios such as influent/effluent comparison in wastewater treatment plants and anomaly early warning in industrial process water, engineers are more concerned with trend changes, shock loads, and process responses than with single-point laboratory values. Multispectral data is well-suited for this type of continuous, high-density water quality analysis.
What Do the Six Online Signals Reflect?
The following table lists the operational meaning and common limitations of the six trend signals output by the NSDD6.
| Signal | Field Trend Meaning | Common Interference/Limitation |
|---|---|---|
| TOC | Total organic carbon trend, reflecting changes in organic load | Affected by sample matrix; requires site-specific calibration |
| COD | Chemical oxygen demand trend, reflecting oxidizable substance load | Spectroscopic method is a correlation model, not equivalent to dichromate reflux |
| UV254 | Trend of aromatic organic compounds and some disinfection byproduct precursors | Represents specific absorbing components only, not full-spectrum organic carbon |
| Turbidity | Light scattering trend from particles and colloids | High turbidity may interfere with spectral models; requires cleaning and maintenance |
| Color | Trend of dissolved/colloidal color-causing substances | Color sources are diverse; not entirely equivalent to organic pollution |
| Temperature | Affects reaction rates, oxygen solubility, and spectral background | Used for compensation and quality flagging; does not directly indicate pollution |
TOC and COD
TOC represents total organic carbon, while COD represents chemical oxygen demand. Both reflect overall organic pollution levels, but their chemical principles differ. The on-site spectroscopic COD trend is based on a site-specific correlation model, not a dichromate reflux experiment. It is suitable for observing load fluctuations but not for direct compliance determination.
UV254 and Color
UV254 primarily responds to aromatic organic compounds, some humic substances, and disinfection byproduct precursors that absorb at 254 nm. Color reflects light-absorbing substances in the visible range. Both may rise simultaneously, or only one may change. For example, some highly humic waters have high UV254, but color may not be obvious; some industrial dye wastewaters have high color but weak absorption at 254 nm. Therefore, grab sampling is needed to understand site-specific characteristics.
Turbidity
Turbidity is not a chemical pollution indicator but a measure of optical interference and particle load. High turbidity enhances light scattering and reduces effective path length, interfering with spectral modeling of organics. The NSDD6's automatic physical cleaning can reduce fouling, but transient high turbidity from storms or sludge bulking may still cause spurious data, which should be flagged and verified with grab samples.
Difference Between Online COD Sensor Trend and Laboratory Analysis
Online COD sensors and laboratory COD analysis have fundamentally different goals. Laboratory methods (e.g., dichromate reflux) have defined chemical reactions, digestion conditions, and metrological traceability, making them suitable for compliance judgment. Online spectroscopy provides continuous trend values through statistical regression between optical signals and laboratory results under site-specific conditions.
Therefore, online values cannot directly replace laboratory reports. The correct statement is: The NSDD6's COD trend is for process early warning, influent/effluent comparison, and dosing strategy reference. Only after a validated correlation model with site-specific laboratory data is established can it be used for operational management. For external reporting or environmental acceptance, laboratory methods recognized by local regulators must still be used.
Limitations of Inter-Signal Correlations
Multiple parameters rising simultaneously does not mean the same event, nor a fixed conversion relationship. Common misconceptions include:
- COD and TOC are not in a fixed ratio: The COD/TOC ratio for the same water sample is influenced by organic molecular structure, oxidation state, and inorganic reducing substances. Different sites and even different seasons may require separate modeling.
- UV254 cannot replace TOC: UV254 only represents specific UV-absorbing components and responds weakly to organics without conjugated structures, such as alcohols and sugars.
- Turbidity and color are not the same: Turbidity arises from particle scattering, while color comes from dissolved/colloidal light-absorbing substances. High color water may not have high turbidity.
- Temperature is not a pollution indicator: Although temperature is used for compensation, it cannot alone determine water quality deterioration.
Understanding these limitations prevents misinterpreting multispectral trends as deterministic pollutant composition analysis.
How to Establish Site Correlations Using Grab Samples
To make NSDD6 trend values more meaningful for operational management, follow these four steps to establish site correlations.
Step 1: Determine representative grab sampling points and time windows. Sampling points should be as close as possible to the sensor installation location to avoid water quality changes from long-distance transport. Record the exact time of each grab sample and align it with online data timestamps.
Step 2: Cover a sufficiently wide concentration range. Sampling only near normal values cannot validate correlations. Use different operating conditions and time periods to cover low, medium, and high concentration ranges. For example, in wastewater treatment plants, collect dry weather influent, wet weather combined flow, and secondary effluent.
Step 3: Perform laboratory analysis using standard methods. Use appropriate laboratory methods for each parameter: COD by dichromate method, TOC by catalytic combustion or wet chemical oxidation, UV254 by spectrophotometry after filtration, turbidity by scattered light method, and color by dilution multiple method or spectrophotometry. Laboratory results serve as reference values; online signals are predictor variables.
Step 4: Build the regression and validate independently. Use most of the data to build the regression relationship, reserving a portion of independent grab samples not used in modeling for validation. Observe whether residuals are randomly distributed and whether seasonal drift exists. Revalidate the model after process changes, influent source changes, or cleaning cycle adjustments.
Engineering Deployment and Validation Considerations
- Installation location: Choose a well-mixed, low-bubble measurement point representative of the main flow conditions. Avoid dead zones, drops, or strong aeration areas.
- Cleaning and maintenance: The NSDD6 has automatic physical cleaning, but periodic manual inspection of the measurement window is still necessary based on on-site fouling conditions. Clean the sensor housing if needed.
- Data timestamps: When connecting to SCADA or data loggers via RS485, ensure device clocks are synchronized for precise matching with grab sample records.
- Alarm strategy: Prioritize trend slope, relative change, or moving average alarms rather than relying solely on single-point absolute limits to reduce false alarms from transient interference.
- Operational log: Record cleaning, calibration, grab sampling, and abnormal events to facilitate data quality tracing and model optimization.
FAQ
Q: Can the NSDD6's online COD value directly replace laboratory COD testing?
No. The online COD sensor provides a trend screening value under site-specific correlation. Only laboratory method results completed according to local regulatory requirements can be used for compliance determination.
Q: Is there a fixed conversion factor between TOC and COD?
No universal fixed factor exists. The relationship depends on organic molecular structure, oxidation state, and matrix interference in the sample. Establish a regression using grab samples at the target site and validate periodically.
Q: What is the impact of increased turbidity on NSDD6 measurement?
High turbidity enhances light scattering and may interfere with spectral models. The NSDD6's automatic physical cleaning reduces fouling, but during high shock turbidity, combine with grab sample verification. If necessary, flag suspicious data or temporarily increase sampling verification frequency.
Discuss your application
Tell us your target parameters, water matrix, interface and annual volume. Our engineering team will recommend a practical configuration.
Request a Quote