
# NSDD6 Turbidity Monitoring and COD Sensor Price Selection: Particles, Bubbles, and Installation Conditions
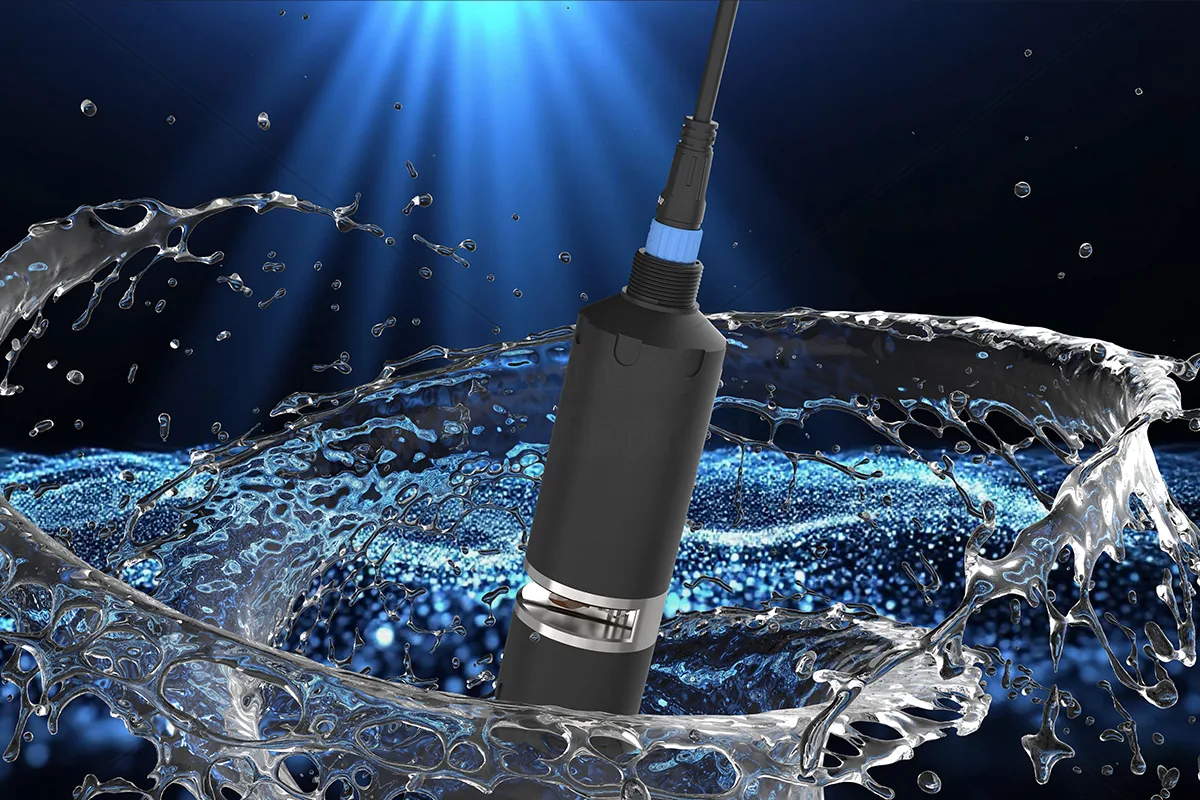
In online water quality monitoring, turbidity serves as a comprehensive indicator of suspended solids and optical characteristics, often used for trend assessment in wastewater treatment and surface water systems. However, in field conditions, bubbles, optical window fouling, and improper flow patterns can distort readings, drowning real particle signals in noise. This article focuses on the NSDD6 industrial multi-spectral water quality sensor, discussing the effects of suspended particles, bubbles, optical path, flow conditions, and cleaning status on turbidity trends, and providing installation and troubleshooting steps. It should be noted that the turbidity output of the NSDD6 is intended for field screening and trend monitoring, and does not replace laboratory compliance analysis. When evaluating solutions, in addition to measurement performance, the COD sensor price, maintenance costs, and installation suitability should also be considered.
Suspended Particles and Bubbles: Two Signals in Turbidity Trends
Optical turbidity measurement relies on changes in scattering or transmission as a light beam passes through a water sample. Suspended particles (e.g., sediment, flocs, microorganisms) produce relatively stable scattering signals, with changes typically related to treatment process or external input, appearing as gradual rises, falls, or sustained plateaus. Bubbles, in contrast, are discrete gas phases in water that, due to significant refractive index differences, produce strong instantaneous scattering peaks.
The engineering significance of distinguishing between the two lies in: particle signals correspond to real water quality changes, while bubble signals are flow or aeration disturbances. On-site judgment can be made by observing trend patterns:
- Turbidity increases caused by particles typically last from minutes to hours and are associated with changes in influent load or sludge settleability.
- Bubble interference appears as high-frequency spikes or sawtooth fluctuations, often accompanied by pump start/stop, water falling, aeration, or pipe air intake.
- If spikes disappear when the sensor is placed in a quiescent beaker or a bypass flow stabilization tank for re-measurement, bubble interference in the in-situ environment is confirmed.
The NSDD6 uses non-contact spectral measurement, where the measurement window does not directly contact the water sample, reducing the probability of bubble attachment to the window to some extent. However, free bubbles in the water path can still affect readings through the optical path.
Optical Path and Flow Conditions: Installation Position Determines Data Quality
The optical path is the water region between the sensor's transmitting and receiving optical signals. Any bubbles, large particle agglomerates, or sediment in this region will alter scattering intensity. Therefore, installation location and flow control are critical to the stability of turbidity trends.
Recommended installation principles are as follows:
- Avoid bubble-rich zones: Do not install directly above aeration heads, downstream of weirs with falling water, or immediately adjacent to pump outlets. Prefer areas with smooth water flow and completed bubble rise.
- Orient the measurement window: In open channels or pipes, orient the measurement window downward or downward to the side to reduce bubble attachment and sediment settling on the window.
- Control flow velocity: Too low a velocity can cause suspended solids to settle; too high a velocity may generate turbulence and bubbles. It is recommended to install in a bypass pipe or flow cell with stable laminar flow, controlling velocity within the sensor's permissible range (refer to the product manual).
- Avoid direct sunlight: For surface water monitoring, a light shield should be installed to prevent ambient light interference.
Flow variations (such as stormwater runoff or process return switching) can alter local bubble concentrations and particle distributions. Therefore, historical trends from the same monitoring point should be compared under similar flow conditions.
Impact of Automatic Cleaning on Turbidity Trends
Window fouling is the biggest challenge for long-term operation of optical sensors. Biofilms, oil films, or inorganic scaling can absorb or scatter light, causing baseline drift and reduced sensitivity. The NSDD6 is equipped with automatic physical cleaning, which maintains a clean measurement window through periodic brushing or scraping.
The impact of cleaning status on trend data is reflected in:
- During cleaning actions, particles and bubbles near the window are disturbed, potentially causing brief spikes or dips in readings. The data acquisition system should recognize the cleaning cycle and mark or exclude data during and shortly after cleaning to avoid false alarms.
- If cleaning intervals are too long, window fouling gradually accumulates, slowly raising the turbidity baseline, with trends appearing as a 'stepped rise.' The degree of fouling can be assessed by observing whether readings return after cleaning.
- If cleaning intervals are too short, mechanical wear and energy consumption increase, and continuous measurement is disturbed. A reasonable cleaning cycle (e.g., in days or hours) should be set based on actual water quality, determined during commissioning by comparing pre- and post-cleaning data.
Installation Conditions and Factors Influencing COD Sensor Price: How to Reduce Total Cost of Ownership
In technical selection, the COD sensor price is only part of the initial procurement cost. Installation conditions, maintenance frequency, and consumable requirements directly impact long-term operating expenses. For reagent-free, auto-cleaning multi-spectral sensors like the NSDD6, the value lies in reducing manual maintenance and reagent consumption, but only if the installation position is reasonable and flow conditions are controlled.
The following factors indirectly affect total cost of ownership:
| Installation conditions | Impact on maintenance | Impact on cost |
|---|---|---|
| Bubble-rich zone | Frequent abnormal readings, requiring manual verification | Increases labor and invalid alarm handling costs |
| Stable flow bypass cell | Stable measurement, longer cleaning intervals | Reduces maintenance frequency and spare part consumption |
| High turbidity/high grease environment | Rapid window fouling, requiring more frequent cleaning | Shortens cleaning component life, increases replacement costs |
| Proper installation and regular calibration | Reliable data, reducing repeat sampling | Reduces regulatory comparison and misjudgment costs |
Therefore, when comparing different brands or models, one should not compare only the COD sensor price, but also estimate installation retrofitting costs, auto-cleaning capability, reagent-free operation, and long-term maintenance hours.
Troubleshooting Steps: From Abnormal Readings to Root Cause
When turbidity trends are abnormal, it is recommended to troubleshoot in the following order:
- Verify data acquisition status: Check sensor power, RS485 communication, and cleaning action to rule out electrical faults.
- Inspect the cleaning mechanism: Check whether the cleaning brush/wiper is in place and whether the window has visible fouling or bubble attachment.
- Eliminate bubble interference: Temporarily move the sensor into a quiescent water sample and measure; if readings recover, the issue is in-situ bubbles, and the installation position should be adjusted or a flow stabilization device added.
- Check flow variations: Review process operation records (pumps, aeration, return flows) to determine if abnormal periods coincide with equipment start/stop or flow surges.
- Perform laboratory comparison: Collect parallel water samples for laboratory analysis (e.g., ISO 7027 method), comparing trend direction rather than absolute values. If laboratory data also rise, it is a real water quality change; if laboratory data are stable while sensor readings rise, suspect window fouling or optical drift.
- Execute calibration or maintenance: According to comparison results, perform zero/span calibration or manual window cleaning, and re-verify.
Common phenomena and possible causes are shown in the table below:
| Phenomenon | Possible cause | Handling direction |
|---|---|---|
| Instantaneous spikes in readings | Bubbles, large particles passing through | Check flow conditions, add stabilization measures |
| Slow baseline upward drift | Window fouling, biofilm | Shorten cleaning cycle or manually clean |
| Periodic fluctuations | Cleaning cycle, pump start/stop | Optimize cleaning timing, adjust installation position |
| Readings persistently low | Sediment covering window, light source aging | Clean and inspect optical window, contact manufacturer |
| Data jumps but laboratory normal | Electrical interference, poor grounding | Check cable shielding and grounding, rewire |
Limitations and Validation Methods
The turbidity measurement of the NSDD6 is for continuous trend monitoring and process early warning, and does not replace laboratory compliance analysis. Its output values are based on spectral model conversion, and different water compositions (such as color, particle size distribution) may affect correlation. After field deployment, parallel water samples should be periodically collected and sent to the laboratory to establish a localized comparison relationship.
Validation methods include:
- Collect instantaneous samples weekly or monthly for laboratory turbidity analysis, calculate the time-matched deviation between sensor and laboratory data;
- Check sensor response in standard solutions of known turbidity (e.g., formazin) to confirm linear trends;
- Review long-term trends seasonally to identify model shifts due to algae, rainfall, or process adjustments.
All compliance discharge reports must be based on certified laboratory methods; sensor data are for process control reference only.
FAQ
Q: What are the main factors affecting COD sensor price?
A: In addition to measurement principle and accuracy, whether it has automatic cleaning, is reagent-free, communication interface, materials (such as 316L stainless steel, POM), and installation accessories all affect the COD sensor price. For multi-parameter sensors like the NSDD6, the price is typically higher than a single turbidity meter, but it can simultaneously output multiple indicators such as TOC, COD, and UV254, making the overall cost more advantageous under long-term reagent-free operation. Selection should comprehensively evaluate installation conditions, maintenance cycles, and process requirements, rather than merely comparing initial quotes.
问:NSDD6 的浊度测量能否用于排放达标报告?
答:不能。NSDD6 的浊度输出为现场连续趋势监测,未经实验室方法认证,不能作为合规排放报告的法定数据。若需用于监管上报,必须采用经认证的实验室分析方法(如 ISO 7027)并出具正式报告。在线传感器数据可用于预警、工艺优化和内部考核,但不能替代实验室检测。
Discuss your application
Tell us your target parameters, water matrix, interface and annual volume. Our engineering team will recommend a practical configuration.
Request a Quote