
# UV254 Online Trends: What Needs to Be Verified in NSDD6 Projects
In wastewater treatment and industrial process water management, UV254 has become a commonly used surrogate for organic matter. By measuring the ultraviolet absorbance of a water sample at 254 nm, it reflects the concentration of organic compounds containing conjugated double bonds or aromatic rings. Compared with laboratory COD/TOC analysis, a UV254 sensor can output trend data continuously and without reagents, but treating it directly as "online COD" is often not valid. Taking the NSDD6 multiparameter water quality sensor as an example, this article discusses the application value of UV254 online trends, the limits of correlation, the method for synchronizing reference samples, and what evidence should be retained during project acceptance.
Why UV254 Trends Are Worth Monitoring Online
UV254 is the characteristic absorption wavelength of natural organic matter in water (such as humic and fulvic acids) and some industrial organic compounds (such as phenols, dyes, and lignin). For the same water source or process stage, an increase in UV254 usually indicates a higher organic load, while a decrease indicates a lower load. Continuous online measurement can capture transient changes that discrete laboratory sampling easily misses, such as stormwater overflow, process shocks, backwash return flows, or dosing anomalies.
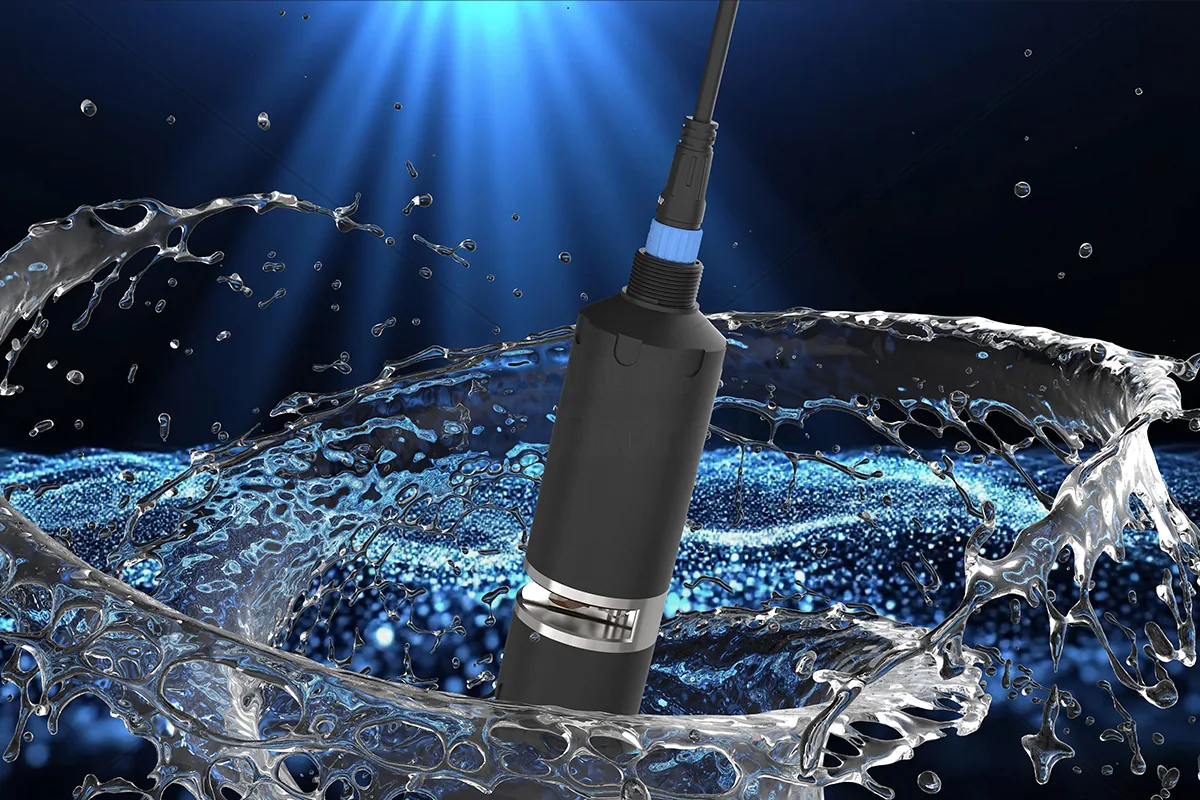
The NSDD6 uses non-contact spectral measurement, requires no chemical reagents, and features automatic physical cleaning, making it suitable for long-term deployment at wastewater treatment plant influent, biochemical tank effluent, or discharge outlets. It simultaneously outputs six parameters: TOC, COD, turbidity, color, UV254, and temperature. Turbidity and color can help determine whether changes in UV254 are due to actual organic matter changes or to interference from particulates, bubbles, or color.
However, it must be clear: UV254 is a spectral surrogate parameter, not an equivalent measurement of laboratory COD or TOC. Regulatory compliance reports still require standard laboratory methods. The role of online UV254 is trend screening, process early warning, and control feedback, not legal data.
Applicable Boundaries of UV254 Trends: What It Measures and What It Does Not
UV254 mainly responds to organic compounds containing C=C double bonds or aromatic rings. For organic compounds without ultraviolet absorption (such as methanol, ethanol, and glucose), UV254 shows almost no response. This means:
- In the same water sample, if the types of organic matter remain relatively unchanged, the correlation between UV254 and COD/TOC is usually good;
- If the influent sources are complex or the process changes, the previously established correlation model may become invalid;
- Turbidity, color, bubbles, and suspended solids all interfere with the optical path, causing UV254 to rise or fluctuate. The turbidity and color outputs of the NSDD6 can help in judgment, but cannot completely eliminate interference;
- Temperature changes affect sample absorption. The built-in temperature measurement of the NSDD6 can help compensate or flag anomalies, but the specific algorithm must follow the manufacturer's calibration.
Therefore, UV254 trends are better suited to answering "is the organic load rising or falling", "is the process being impacted", and "does dosing need adjustment", rather than "what exactly is the current COD in mg/L". The latter requires standard laboratory methods.
What Needs to Be Verified for UV254 in NSDD6 Projects
During project acceptance or long-term operation, verification is recommended for the following five aspects:
1. Installation Location and Representativeness
The sensor should be installed in a location with adequate mixing, stable flow velocity, and minimal risk of sediment or gas accumulation. For discharge outlets, select a sampling point that represents the final discharge water quality; for process stages, it must be clear whether the UV254 trend corresponds to influent, biochemical tank, or effluent, as baselines differ completely by location.
2. Effectiveness of Cleaning and Maintenance
The automatic physical cleaning of the NSDD6 can reduce biofilm and particulate attachment, but long-term operation still requires manual verification of window cleanliness. During acceptance, record the cleaning cycle and signal changes before and after cleaning, and confirm that the cleaning mechanism works properly. In heavily fouled locations, manual wiping frequency may need to be increased.
3. Optical Zero Point and Stability
Although no reagents are used, the optical system still needs periodic zero-point verification with pure water or a known low-absorption solution. Trend drift may come from light source aging, window scaling, or electronic drift. Record the initial blank signal at installation, and recheck weekly or monthly during operation. If zero-point drift exceeds an acceptable range, contact the manufacturer or recalibrate.
4. Correlation with Laboratory Reference Samples
This is the most important verification. The absolute UV254 value alone cannot determine COD or TOC; water samples must be collected on site in synchronization with sensor readings and analyzed in the laboratory to establish a local relationship between UV254 and COD/TOC. The NSDD6 simultaneously outputs turbidity and color, which can help identify samples unsuitable for inclusion in the correlation model (for example, high-turbidity samples usually raise apparent UV254 without representing an increase in dissolved organic matter).
5. Data Integrity and Transmission Stability
The NSDD6 features isolated RS485 communication. Acceptance should verify that data is continuous, timestamps are correct, and breakpoints are backfilled or flagged. The value of trend data lies in continuity; frequent packet loss weakens early warning capability.
Reference Sample Synchronization Method: From Site to Laboratory
To turn the UV254 trends of the NSDD6 into evidence-based process decisions, conduct intensive comparison for 4–8 weeks in the early project stage, then switch to periodic verification.
Step 1: Determine Sampling Points and Sampling Regime
Collect instantaneous water samples near the sensor installation point, timing them to coincide with sensor readings as closely as possible. Use glass or inert plastic sampling bottles to avoid adsorption of organic matter. Record auxiliary information such as sampling time, water temperature, turbidity, and color.
Step 2: Synchronously Record Sensor Readings
Record the UV254, turbidity, color, and temperature output by the NSDD6 at the same moment, as well as the calculated COD/TOC (if enabled). Note that the sensor outputs estimated values converted through an internal model; this model is usually based on general calibration and is not guaranteed to apply to local water samples.
Step 3: Laboratory Analysis and Correlation Modeling
Send the water samples to a qualified laboratory to measure COD (dichromate method or equivalent standard) or TOC (high-temperature combustion or wet chemical method). Plot the laboratory results against the synchronized UV254 values in a scatter diagram and calculate the linear correlation coefficient. If the correlation is good, establish a local conversion formula to convert UV254 trends into an estimated COD range; if poor, check interference factors or consider using UV254 only as a qualitative trend alarm.
Note: The local correlation model applies only to the water quality characteristics of that site and period. Once the water source or process changes, the model must be re-verified. The model of Plant A cannot be directly used for Plant B.
How to Turn Trends into Process Decisions
At the influent of a wastewater treatment plant, a sudden rise in UV254 may indicate illegal industrial discharge or rainy-season overflow; at the biochemical tank effluent, a steady decline in UV254 indicates good treatment performance; at the advanced treatment effluent, a simultaneous rise in UV254 and color may indicate coagulation failure. By setting thresholds and rate-of-change alarms, intervention can be made in advance.
Common misconceptions in reference sample synchronization include:
- Building a model from just one water sample: at least 20 pairs of valid data are needed to preliminarily assess correlation;
- Ignoring time delay: if there is a long distance between the pipeline sampling point and the sensor, consider hydraulic retention time;
- Using the COD compliance value as the model calibration point: calibration should cover the actual concentration range, preferably including low, medium, and high levels;
- Not updating the model in time: seasonal changes and industrial source changes alter organic matter composition.
Evidence to Be Retained for Project Acceptance
Acceptance is not just about whether the sensor can read values, but about proving that the data is credible, maintenance is feasible, and boundaries are clear. Archive the following materials:
| Evidence Category | Specific Content | Purpose |
|---|---|---|
| Installation Records | Photos of installation location, pipe/channel dimensions, sensor immersion depth, fixing method | Confirm sampling representativeness |
| Cleaning and Maintenance Records | Automatic cleaning cycle settings, manual cleaning dates, signal changes before and after cleaning | Demonstrate that optical window condition is controllable |
| Calibration and Zero-Point Verification | Verification records with pure water or standard absorption solution, drift amount, verification date | Track optical system stability |
| Reference Sample Comparison Report | Synchronized sampling records, laboratory COD/TOC results, correlation scatter diagram, model formula | Support quantitative interpretation of trend data |
| Data Integrity Report | Data acquisition rate, breakpoint statistics, timestamp verification | Assess continuous monitoring capability |
| Anomaly and Handling Records | Interference events such as high turbidity, bubbles, and scaling, and treatment measures | Explain data limitations and corrective actions |
These evidence materials should be kept as part of the project acceptance documentation and continuously updated during subsequent operation. In particular, the reference sample comparison report should be reviewed at least quarterly, with increased frequency during flood season or after process adjustments.
FAQ
Q: Can the COD output of the NSDD6 replace laboratory COD? A: No. The COD output by the NSDD6 is a trend value estimated from a spectral model and is intended for process monitoring. Compliance reports, discharge fee billing, or enforcement data must use standard laboratory methods. The value of the NSDD6 lies in continuous trends and anomaly early warning, not in replacing legal analysis.
Q: Can a UV254 sensor be used to control dosing? A: Yes, but a local correlation must first be established. Where correlation is good and interference is controllable, UV254 trends can serve as feedforward or feedback signals to help optimize coagulant, oxidant, or carbon source dosing. If correlation is poor, use it only as a trend alarm to avoid miscontrol.
Q: What installation environments is the NSDD6 suitable for? A: According to the product description, the NSDD6 is suitable for surface water, industrial and domestic wastewater, treatment plant effluent, and discharge monitoring. It features a 316L stainless steel and POM industrial construction, as well as automatic physical cleaning, making it suitable for long-term field or harsh industrial environments. However, the maintenance cycle should still be evaluated based on on-site conditions such as turbidity, grease, and entanglement.
Conclusion
UV254 online trends are a low-cost, high-density means of sensing changes in organic matter, but trust must be built through verification rather than assumption. In NSDD6 projects, only by clarifying the installation location, maintaining cleanliness, conducting regular comparisons, and retaining evidence can trend data be turned into reliable operational decisions.
Discuss your application
Tell us your target parameters, water matrix, interface and annual volume. Our engineering team will recommend a practical configuration.
Request a Quote