
Why Establish a Baseline Before Setting Alarm Thresholds in Online Water Quality Monitoring
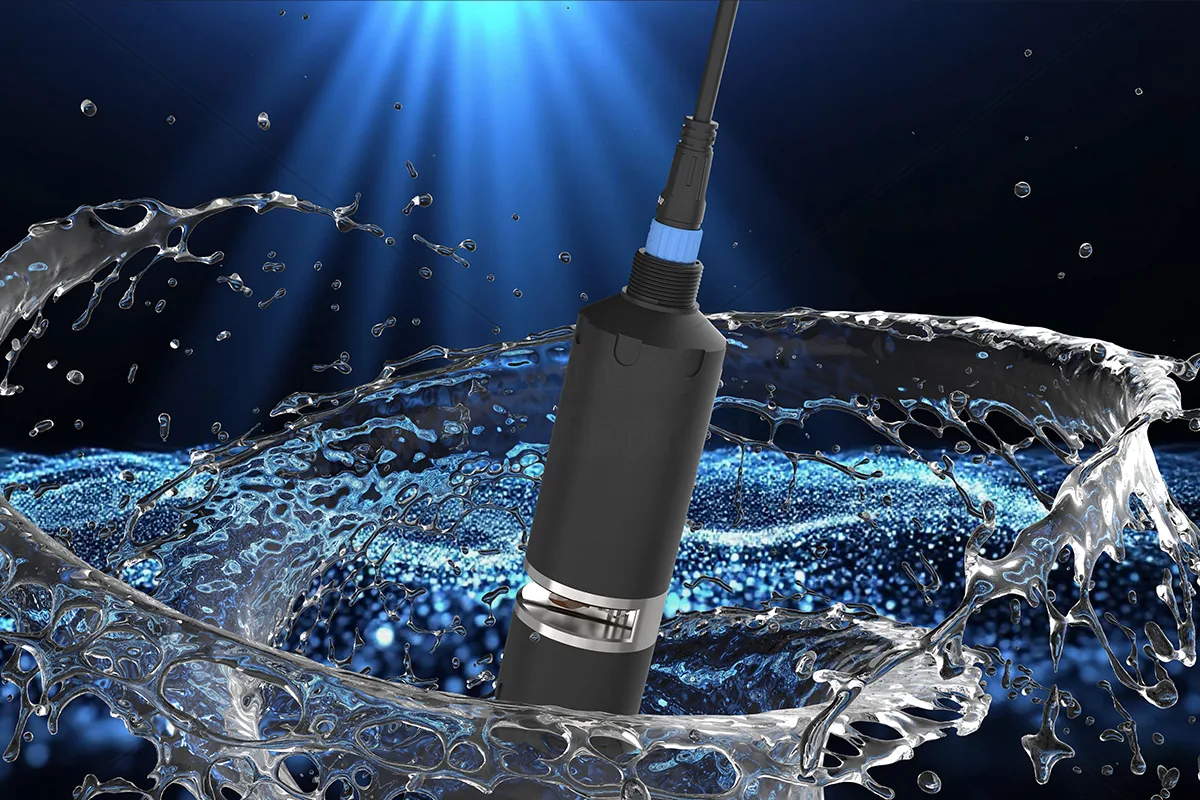
Online water quality monitoring often falls into the dilemma of 'more data, harder judgment.' Sensors report every minute, but operators don't know which changes are normal influent fluctuations or process switches, and which are sensor fouling or equipment faults. Taking the NSDD6 industrial multispectral water quality sensor as an example, it simultaneously outputs TOC, COD, turbidity, color, UV254, and temperature based on reagent-free, non-contact spectral measurement, providing multi-parameter synchronized data for baseline establishment.
Without a baseline, thresholds are often set based on environmental impact assessments or discharge standards, but these do not represent the normal fluctuation range on site. For example, influent COD may differ several-fold between day and night due to production batches, and fixed thresholds will cause many false alarms. A baseline describes 'the normal range, fluctuation rhythm, and response pattern of the indicator at this point under current operating conditions.' Only with a baseline does exceeding a limit become meaningful.
Four Key Data Types for Building a Baseline with NSDD6
1. Influent Fluctuation
Continuously record influent TOC, COD, UV254, turbidity, and other parameters, and statistically analyze their distributions by time period (hour, shift, day, week). Influent fluctuation is not a single value but an envelope: for instance, UV254 at a point typically falls within a certain range, and turbidity shows short-term spikes during rain or flushing. The multi-parameter output of NSDD6 helps distinguish organic load changes from mere turbidity interference.
Operational advice: Cover at least 2–4 weeks; if production is periodic (e.g., weekend shutdown, batch changes), include a complete cycle.
2. Process Switch
During operations such as aerobic/anoxic switching, reflux ratio adjustment, sludge discharge, and chemical dosing in wastewater treatment units, water quality parameters change according to a certain pattern. Record the time series before and after switching to form a 'switch template.' For example, after switching from anoxic to aerobic, TOC or COD may first decrease rapidly, then plateau as nitrification/denitrification proceeds; if such features are missing from the baseline, later it is impossible to distinguish switch failure from sensor malfunction.
Mark the timestamps of process events in the baseline to avoid misjudging normal process responses as pollution events.
3. Cleaning Status
NSDD6 features automatic physical cleaning to control fouling on the optical window. The baseline needs to record the data recovery curve before and after cleaning. If data returns to the normal range within the expected time after cleaning, the measurement status is good; if data drifts or fails to recover after cleaning, prioritize checking the cleaning mechanism, water scaling type, installation position, etc.
Establishing a 'cleaning recovery baseline' helps optimize cleaning cycles: cleaning too frequently increases energy consumption and wear, while cleaning too infrequently leads to continuous fouling of the data window.
4. Grab Sample Records
Online sensors must be benchmarked against grab sample laboratory analysis. The spectral measurements of COD/TOC etc. by NSDD6 are surrogate measurements, not standard analytical methods, so site-specific mapping must be established using on-site water samples.
For each grab sample, record: time, location, sensor reading, laboratory method result, water sample appearance, temperature, turbidity, etc. After comparison, calculate the relative deviation and observe whether the deviation varies with concentration range or season. Apply segment correction if necessary, but do not frequently modify coefficients; first confirm whether the water sample matrix is stable. Grab sample records are the 'anchors' of the baseline, connecting online data with compliance laboratory data.
Implementation Steps for Establishing a Baseline
- Determine monitoring points and parameter priority: select key parameters from NSDD6 outputs based on process goals, such as influent COD/TOC, effluent UV254, etc.
- Set data recording frequency: store one entry every 5–15 minutes, and retain raw data rather than just averages to preserve peaks and fluctuation information.
- Continuously collect and mark events: mark process switches, cleaning, maintenance, rainfall, production changes, etc. in the data system.
- Calculate the normal envelope: use quantiles or sliding window mean ± standard deviation to describe the normal range, rather than simply using min/max.
- Cross-validate: use grab sample records to verify the consistency of online data and establish a site-specific acceptable deviation range.
- Create a baseline document: include the normal envelope, major fluctuation patterns, cleaning recovery curves, grab sample comparison results, recommended alarm thresholds, and maintenance triggers.
Setting Review and Maintenance Priority Based on Baseline
The following example shows priority logic; specific thresholds need to be determined through on-site commissioning.
| Monitoring Status | Recommended Review Action | Maintenance/Calibration Priority |
|---|---|---|
| Data within baseline envelope | No immediate review required; periodic grab sample verification | Routine |
| Data exceeds envelope but below discharge limit | Check process event records and cleaning status; increase grab sampling if necessary | Medium |
| Data exceeds discharge limit or rising rapidly | Immediately send grab sample to laboratory; also check influent and process | High |
| Data flat for a long time, no fluctuation | Check communication and power first, then check measurement window or sensor status | High |
| Data does not recover to baseline after cleaning | Check cleaning mechanism, optical window, installation angle; consider manual cleaning | High |
| Trend after process switch does not match template | Review process parameters; check sensor calibration and whether baseline is outdated | Medium-High |
Priority is not fixed; adjust it based on the point's impact on process control or compliance.
Limitations and Boundaries
- NSDD6's non-contact spectral measurement is suitable for trend monitoring and early warning, but cannot replace standard laboratory methods. Compliance determination must rely on laboratory methods.
- Baselines are time-sensitive. Influent water quality, production processes, seasonal changes, and chemical adjustments can all change the normal envelope. It is recommended to review quarterly and update immediately after major process changes.
- Different points and different water sample matrices require separate baselines. For example, the spectral response of influent and secondary clarifier effluent differs greatly; they cannot share one set of coefficients.
- Automatic physical cleaning can slow fouling but cannot eliminate all optical interference. For severe oil films, biofilms, or high turbidity environments, additional manual maintenance or installation adjustments may be needed.
- Grab sample comparison only indicates the deviation of the online sensor at that time point and cannot be extrapolated to all concentration ranges. If the deviation is unstable, increase grab sampling frequency or consider multi-parameter joint judgment.
Verification Methods
- Continuity verification: after baseline establishment, replay alarm logic with historical data to observe false alarm and missed detection rates.
- Comparative verification: perform laboratory analysis on grab samples at least once a week, calculate the relative deviation between sensor readings and laboratory values, and observe whether it is within an acceptable range.
- Cleaning recovery verification: randomly select cleaning events, check whether the time for data to recover to baseline is stable; if recovery time extends, check the cleaning mechanism or water quality.
- Process switch verification: record whether the data trajectory after switching matches the baseline template; if deviation exceeds the normal range, supplement with grab sampling and inspection.
FAQ
Q: How long does it take to establish an online water quality monitoring baseline?
A: It depends on the fluctuation cycle of operating conditions. It is recommended to collect continuously for at least 2–4 weeks, covering a complete production cycle, cleaning cycle, and at least one process switch. Extend the period if influent fluctuation is large.
Q: Can NSDD6 COD readings be directly used for discharge compliance determination?
A: No. NSDD6 uses non-contact spectral measurement and outputs surrogate parameters, suitable for trend monitoring and early warning; compliance determination should rely on laboratory standard methods (e.g., dichromate method) results.
Q: After the baseline is established, is grab sample comparison no longer needed?
A: No. The baseline needs to be verified and updated regularly with grab sample records. Online sensors may drift, and water quality matrices may change; grab sample comparison is necessary to maintain the validity of the baseline.
Q: How to optimize cleaning frequency based on the baseline?
A: Observe the time for data to recover to the normal baseline envelope after cleaning. If recovery is fast and data is stable before and after cleaning, the cleaning cycle can be appropriately extended; if data deviates significantly before cleaning and recovery is slow, shorten the cleaning cycle or check the cleaning mechanism.
A baseline is not a one-time task but a continuous tool. For engineers, first establish the baseline, then set alarms, and only then can reliable online water quality monitoring be achieved.
Discuss your application
Tell us your target parameters, water matrix, interface and annual volume. Our engineering team will recommend a practical configuration.
Request a Quote